> ## Documentation Index
> Fetch the complete documentation index at: https://docs.dodopayments.com/llms.txt
> Use this file to discover all available pages before exploring further.
# Usage-Based Billing Integration Guide
> Learn how to set up meters and send usage events to enable accurate usage-based billing with Dodo Payments.
Access the complete API documentation for ingesting usage events and test event ingestion requests and responses interactively.
Explore the full API documentation for creating meters and interactively test meter creation requests and responses.
## Creating a Meter
Meters define how your usage events are aggregated and measured for billing purposes.
Before creating a meter, plan your usage tracking strategy:
* Identify what usage events you want to track
* Determine how events should be aggregated (count, sum, etc.)
* Define any filtering requirements for specific use cases
### Step-by-Step Meter Creation
Follow this guide to set up your usage meter:
Set up the fundamental details for your meter.
A clear, descriptive name that identifies what this meter tracks.
Examples: "Tokens", "API Calls", "Storage Usage", "Compute Hours"
A detailed explanation of what this meter measures.
Example: "Counts each POST /v1/orders request made by the customer"
The event identifier that will trigger this meter.
Examples: "token", "api.call", "storage.usage", "compute.session"
The event name must match exactly what you send in your usage events. Event names are case-sensitive.
Define how the meter calculates usage from your events.
Select how events should be aggregated:
Counts the number of events received.
Use case: API calls, page views, file uploads
Calculation: Total number of events
Adds up values from a specific property in your events.
Use case: Data transfer, storage consumption, processing time
Calculation: Sum of all property values
Records the highest value of a specific property during the billing period.
Use case: Peak concurrent users, maximum storage used, highest bandwidth
Calculation: Maximum property value observed
Uses the most recent value of a specific property.
Use case: Current plan tier, latest configuration setting
Calculation: Last recorded property value
The property name from event metadata to aggregate over.
This field is required when using Sum, Max, or Last aggregation types.
The unit label for display purposes in reports and billing.
Examples: "calls", "GB", "hours", "tokens"
Set up criteria to control which events are included in the meter.
Event filtering allows you to create sophisticated rules that determine which events contribute to your usage calculations. This is useful for excluding test events, filtering by user tiers, or focusing on specific actions.
**Enable Event Filtering**
Toggle **Enable Event Filtering** to activate conditional event processing.
**Choose Filter Logic**
Select how multiple conditions are evaluated:
All conditions must be true for an event to be counted. Use this when you need events to meet multiple strict criteria simultaneously.
**Example:** Count API calls where `user_tier = "premium"` AND `endpoint = "/api/v2/users"`
At least one condition must be true for an event to be counted. Use this when you want to include events that meet any of several criteria.
**Example:** Count events where `method = "POST"` OR `method = "PUT"` OR `method = "DELETE"`
**Setting Up Filter Conditions**
Click **Add condition** to create a new filter rule.
Specify the property name from your event metadata.
Choose from available operators:
* `equals` — Exact match
* `not_equals` — Exclusion filter
* `greater_than` — Numeric comparison
* `greater_than_or_equals` — Numeric comparison (inclusive)
* `less_than` — Numeric comparison
* `less_than_or_equals` — Numeric comparison (inclusive)
* `contains` — String contains substring
* `does_not_contain` — String exclusion filter
Set the target value for comparison.
Use **Add Group** to create additional condition groups for complex logic.
Filtered properties must be included in your event metadata for the conditions to work properly. Events missing required properties will be excluded from counting.
Review your meter configuration and click **Create Meter**.
Your meter is now ready to receive and aggregate usage events.
## Linking Meter in a Product
Once you have created your meter, you need to link it to a product to enable usage-based billing. This process connects your meter's usage data to pricing rules for customer billing.
Linking meters to products establishes the connection between usage tracking and billing:
* Products define pricing rules and billing behavior
* Meters provide usage data for billing calculations
* Multiple meters can be linked to a single product for complex billing scenarios
### Product Configuration Process
Transform your usage data into billable charges by properly configuring your product settings:
Navigate to your product creation or editing page and select **Usage Based Billing** as the pricing type.
Click on **Associated Meters** to open the meter selection panel.
This panel allows you to configure which meters will track usage for this product.
In the meter selection panel:
1. Click **Add Meters** to view available meters
2. Select the meter you created from the dropdown list
3. The selected meter will appear in your product configuration
Set the pricing for each unit of usage tracked by your meter.
Define how much to charge for each unit measured by your meter.
**Example**: Setting \$0.50 per unit means:
* 1,000 units consumed = 1,000 × \$0.50 = \$500.00 charged
* 500 units consumed = 500 × \$0.50 = \$250.00 charged
* 100 units consumed = 100 × \$0.50 = \$50.00 charged
Configure a free usage allowance before billing begins.
Number of units customers can consume at no charge before paid usage calculation starts.
**How it works**:
* Free threshold: 100 units
* Price per unit: \$0.50
* Customer usage: 250 units
* **Calculation**: (250 - 100) × \$0.50 = **\$75.00** charged
Free thresholds are ideal for freemium models, trial periods, or providing customers with a base allowance included in their plan.
The free threshold applies to each billing cycle, giving customers fresh allowances monthly or according to your billing schedule.
Review your meter and pricing configuration, then click **Save Changes** to finalize the setup.
Your product is now configured for usage-based billing and will automatically charge customers based on their measured consumption.
**What happens next**:
* Usage events sent to your meter will be tracked and aggregated
* Billing calculations will apply your pricing rules automatically
* Customers will be charged based on actual consumption during each billing cycle
You can add up to 50 meters per product, enabling sophisticated usage tracking across multiple dimensions like API calls, storage, compute time, and custom metrics.
## Sending Usage Events
Once your meter is configured, you can start sending usage events from your application to track customer usage.
### Event Structure
Each usage event must include these required fields:
A unique identifier for this specific event. Must be unique across all events.
The Dodo Payments customer ID this usage should be attributed to.
The event name that matches your meter configuration. Event names trigger the appropriate meter.
ISO 8601 timestamp when the event occurred. Defaults to the current UTC timestamp if not provided. Must fall within 1 hour in the past and 5 minutes in the future — timestamps outside that window are rejected.
Additional properties for filtering and aggregation. Include any values referenced in your meter's "Over Property" or filtering conditions.
### Usage Events API Examples
Send usage events to your configured meters using the Events API:
```javascript Node.js theme={null}
const response = await fetch('https://test.dodopayments.com/events/ingest', {
method: 'POST',
headers: {
'Authorization': `Bearer ${process.env.DODO_PAYMENTS_API_KEY}`,
'Content-Type': 'application/json'
},
body: JSON.stringify({
events: [
{
event_id: "api_call_1234",
customer_id: "cus_atXa1lklCRRzMicTqfiw2",
event_name: "api.call",
timestamp: new Date().toISOString(),
metadata: {
endpoint: "/v1/orders",
method: "POST",
response_size: 1024
}
}
]
})
});
```
```python Python theme={null}
import os
import requests
from datetime import datetime, timezone
response = requests.post(
'https://test.dodopayments.com/events/ingest',
headers={
'Authorization': f"Bearer {os.environ['DODO_PAYMENTS_API_KEY']}",
'Content-Type': 'application/json'
},
json={
'events': [
{
'event_id': 'api_call_1234',
'customer_id': 'cus_atXa1lklCRRzMicTqfiw2',
'event_name': 'api.call',
'timestamp': datetime.now(timezone.utc).isoformat(),
'metadata': {
'endpoint': '/v1/orders',
'method': 'POST',
'response_size': 1024
}
}
]
}
)
```
```curl cURL theme={null}
curl -X POST 'https://test.dodopayments.com/events/ingest' \
-H 'Authorization: Bearer YOUR_API_KEY' \
-H 'Content-Type: application/json' \
-d '{
"events": [
{
"event_id": "api_call_1234",
"customer_id": "cus_atXa1lklCRRzMicTqfiw2",
"event_name": "api.call",
"timestamp": "2024-01-15T10:30:00Z",
"metadata": {
"endpoint": "/v1/orders",
"method": "POST",
"response_size": 1024
}
}
]
}'
```
### Key Things to Know for Reliable Ingestion
Follow these practices to keep usage tracking accurate and resilient in production.
**Use deterministic, idempotent `event_id`s.** The `event_id` must be unique across all events and acts as the idempotency key. A reused `event_id` is treated as a duplicate and not counted again, so retries never double-bill. Derive the ID from the action instead of a random value, e.g. `` `${customer_id}_${action}_${timestamp}` ``.
**Batch events, up to 1,000 per request.** The `/events/ingest` endpoint enforces a hard maximum of 1,000 events per request. Batches larger than that are rejected, so split high volumes across multiple calls. For high-volume workloads, buffer events and flush in batches rather than sending one request per event.
**Retry 5xx and 429, never other 4xx.** Retry on server errors (5xx) and rate limits (429) with exponential backoff. Do not retry 400/422 validation errors — the payload is malformed and will fail every time. Fix it and re-send. Queue events that still fail after retries so none are lost.
**Set timestamps intentionally.** Omit `timestamp` for real-time events and it defaults to the current UTC timestamp. Set it explicitly (ISO 8601) for delayed or batched events so usage lands in the correct billing period. Note the accepted window is narrow: events timestamped more than 1 hour in the past or more than 5 minutes in the future are rejected. Historical backfill is not supported — flush buffered events within the hour.
**Send aggregated metadata as numbers, not strings.** Any property referenced by a meter's Over Property (Sum, Max, Last) must be a numeric type — `{ "tokens": 150 }`, not `{ "tokens": "150" }`. String values will not aggregate.
## Usage-Based Billing Analytics
Monitor and analyze your usage-based billing data with a comprehensive analytics dashboard. Track customer consumption patterns, meter performance, and billing trends to optimize your pricing strategy and understand usage behaviors.
### Overview Analytics
The Overview tab provides a comprehensive view of your usage-based billing performance:
#### Activity Metrics
Track key usage statistics across different time periods:
Shows usage activity for the current billing period, helping you understand monthly consumption patterns.
Displays cumulative usage statistics since you started tracking, providing long-term growth insights.
Use the time period selector to compare usage across different months and identify seasonal trends or growth patterns.
#### Meter Quantities Chart
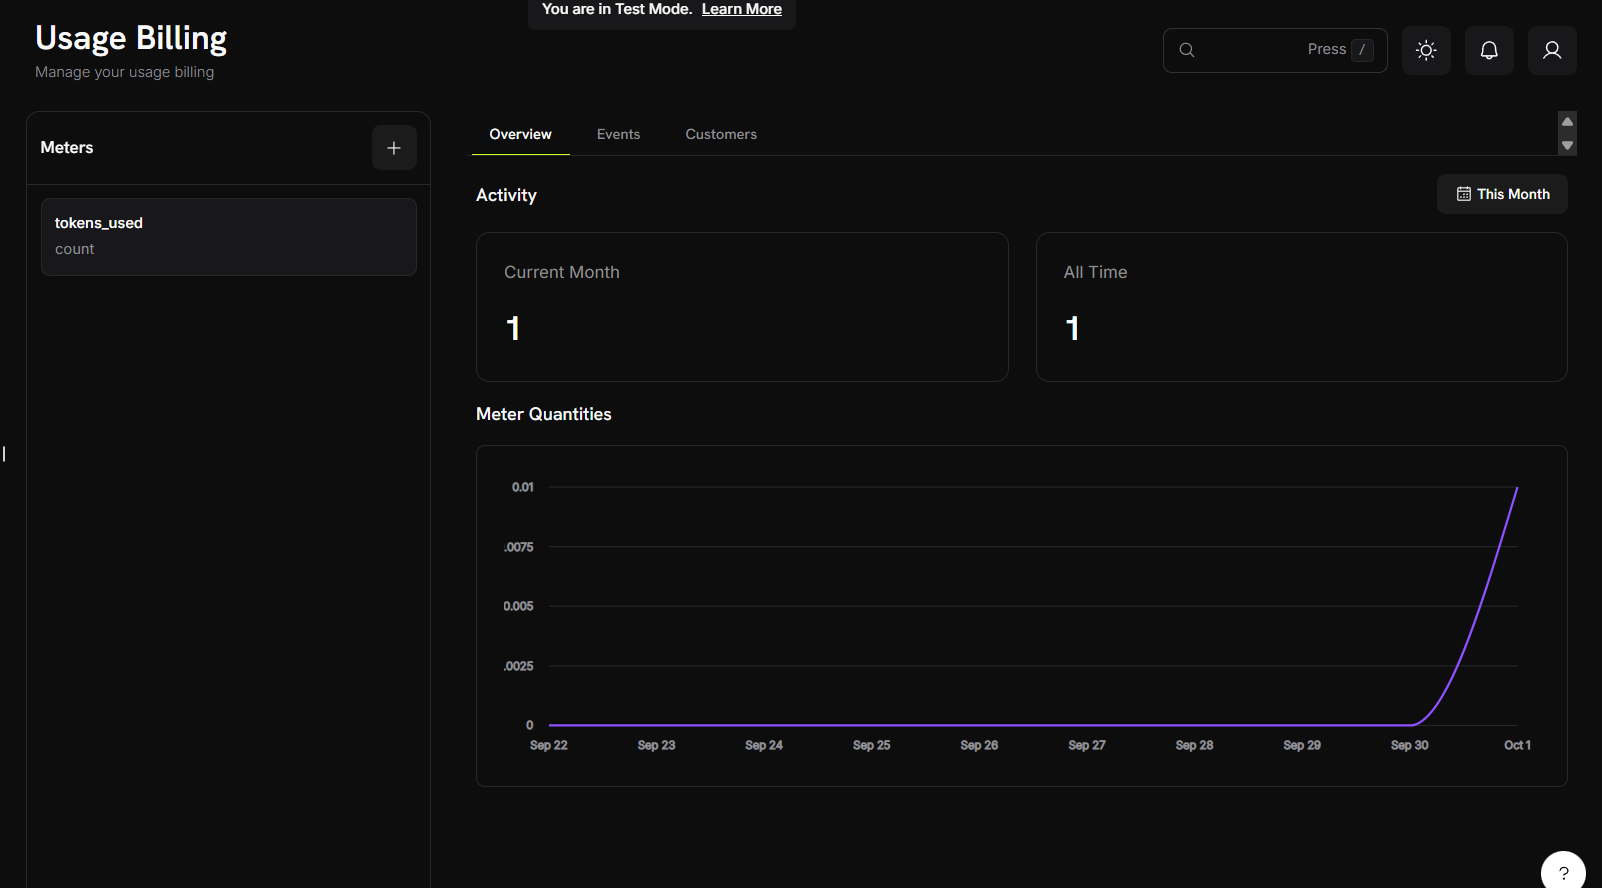 The meter quantities chart visualizes usage trends over time with the following features:
* **Time-series visualization**: Track usage patterns across days, weeks, or months
* **Multiple meter support**: View data from different meters simultaneously
* **Trend analysis**: Identify usage spikes, patterns, and growth trajectories
The chart automatically scales based on your usage volume and selected time range, providing clear visibility into both small fluctuations and major usage changes.
### Events Analytics
The meter quantities chart visualizes usage trends over time with the following features:
* **Time-series visualization**: Track usage patterns across days, weeks, or months
* **Multiple meter support**: View data from different meters simultaneously
* **Trend analysis**: Identify usage spikes, patterns, and growth trajectories
The chart automatically scales based on your usage volume and selected time range, providing clear visibility into both small fluctuations and major usage changes.
### Events Analytics
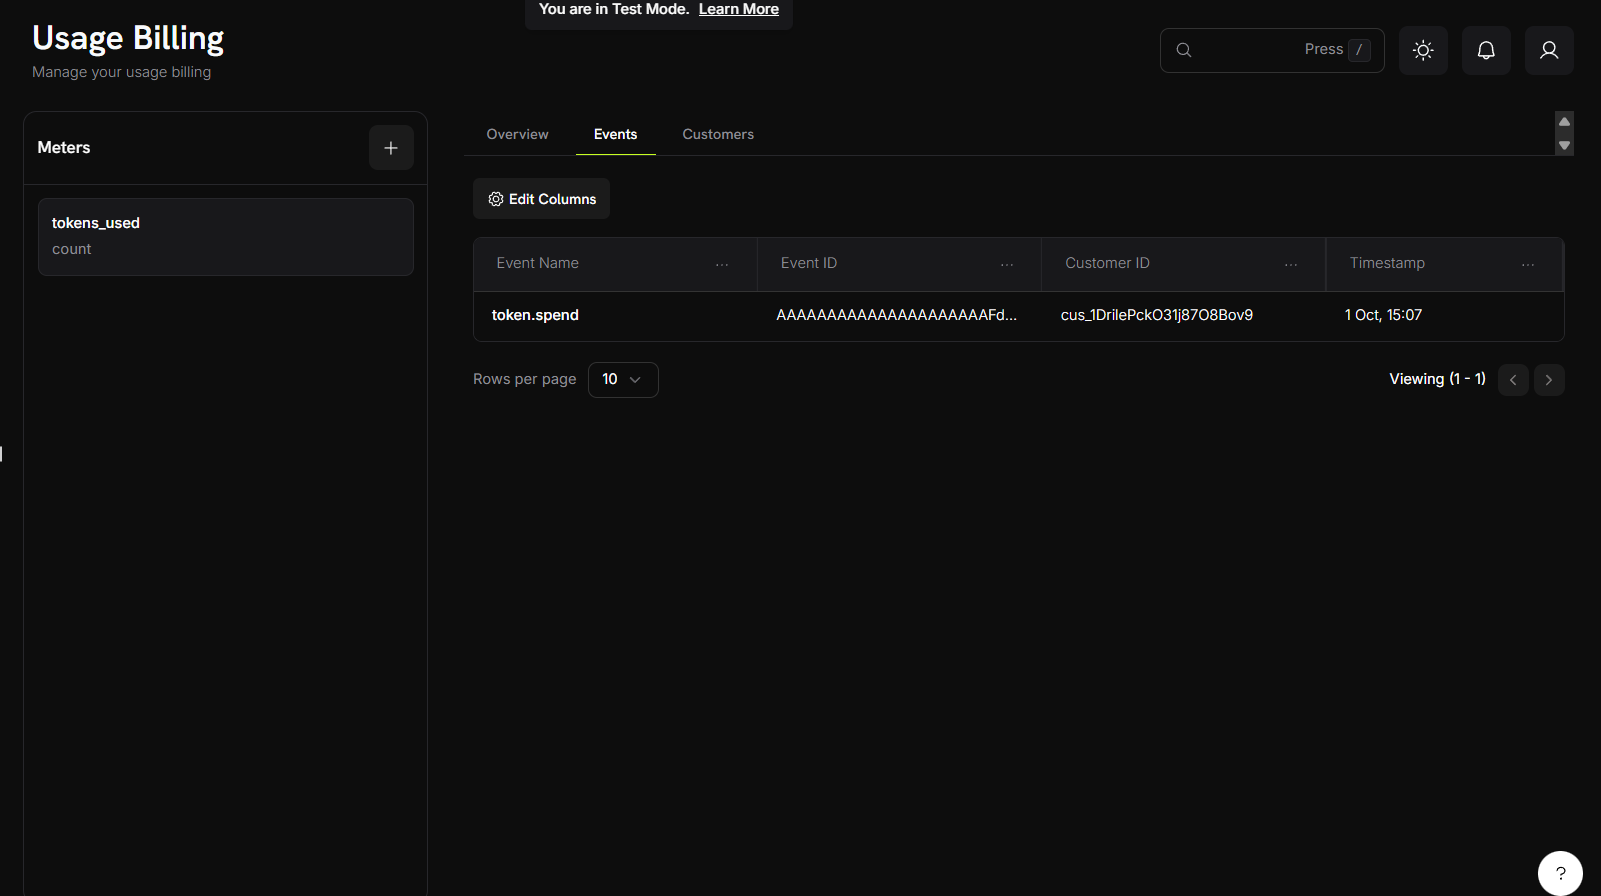 The Events tab provides granular visibility into individual usage events:
#### Event Information Display
The events table provides a clear view of individual usage events with the following columns:
* **Event Name**: The specific action or trigger that generated the usage event
* **Event ID**: A unique identifier for each event instance
* **Customer ID**: The customer associated with the event
* **Timestamp**: When the event occurred
This view allows you to track and monitor individual usage events across your customer base, providing transparency into billing calculations and usage patterns.
### Customer Analytics
The Customers tab provides a detailed table view of customer usage data with the following information:
#### Available Data Columns
The email address of the customer for identification.
A unique identifier for the customer's subscription.
Number of free units included in the customer's plan before charges apply.
The cost per unit for usage beyond the free threshold.
Timestamp of the customer's most recent usage event.
Total amount charged to the customer for usage-based billing.
Total number of units the customer has consumed.
Number of units that exceed the free threshold and are being charged.
#### Table Features
* **Column Filtering**: Use the "Edit Columns" feature to show or hide specific data columns
* **Real-time Updates**: Usage data reflects the most current consumption metrics
## Aggregation Examples
Here are practical examples of how different aggregation types work:
### Understanding Aggregation Types
Different aggregation types serve different billing scenarios. Choose the right type based on how you want to measure and charge for usage.
### Practical Implementation Examples
These examples demonstrate real-world applications of each aggregation type with sample events and expected results:
Scenario: Track the total number of API requests
Meter Configuration:
* Event Name: `api.call`
* Aggregation Type: Count
* Measurement Unit: `calls`
**Sample Events**:
```json theme={null}
{
"events": [
{"event_id": "call_1", "customer_id": "cus_123", "event_name": "api.call"},
{"event_id": "call_2", "customer_id": "cus_123", "event_name": "api.call"},
{"event_id": "call_3", "customer_id": "cus_123", "event_name": "api.call"}
]
}
```
Result: 3 calls billed to customer
Scenario: Bill based on total bytes transferred
Meter Configuration:
* Event Name: `data.transfer`
* Aggregation Type: Sum
* Over Property: `bytes`
* Measurement Unit: `GB`
**Sample Events**:
```json theme={null}
{
"events": [
{
"event_id": "transfer_1",
"customer_id": "cus_123",
"event_name": "data.transfer",
"metadata": {"bytes": 1073741824}
},
{
"event_id": "transfer_2",
"customer_id": "cus_123",
"event_name": "data.transfer",
"metadata": {"bytes": 536870912}
}
]
}
```
Result: 1.5 GB total transfer billed to customer
Scenario: Bill based on highest concurrent user count
Meter Configuration:
* Event Name: `concurrent.users`
* Aggregation Type: Max
* Over Property: `count`
* Measurement Unit: `users`
**Sample Events**:
```json theme={null}
{
"events": [
{
"event_id": "peak_1",
"customer_id": "cus_123",
"event_name": "concurrent.users",
"metadata": {"count": 15}
},
{
"event_id": "peak_2",
"customer_id": "cus_123",
"event_name": "concurrent.users",
"metadata": {"count": 23}
},
{
"event_id": "peak_3",
"customer_id": "cus_123",
"event_name": "concurrent.users",
"metadata": {"count": 18}
}
]
}
```
Result: 23 peak concurrent users billed to customer
### Event Filtering Examples
Only count API calls to specific endpoints:
Filter Configuration:
* Property: `endpoint`
* Comparator: `equals`
* Value: `/v1/orders`
Sample Event:
```json theme={null}
{
"event_id": "call_1",
"customer_id": "cus_123",
"event_name": "api.call",
"metadata": {
"endpoint": "/v1/orders",
"method": "POST"
}
}
```
Result: Events matching the filter criteria are counted. Events with different endpoints are ignored.
Only count large file uploads:
Filter Configuration:
* Property: `file_size`
* Comparator: `greater_than`
* Value: `1048576` (1 MB in bytes)
Sample Event:
```json theme={null}
{
"event_id": "upload_1",
"customer_id": "cus_123",
"event_name": "file.upload",
"metadata": {
"file_size": 5242880,
"file_type": "image"
}
}
```
Result: Files larger than 1 MB are counted. Smaller files are ignored.
Count premium API calls during business hours:
Filter Configuration (using AND logic):
* Property: `plan_type`, Comparator: `equals`, Value: `premium`
* Property: `hour`, Comparator: `greater_than_or_equals`, Value: `9`
* Property: `hour`, Comparator: `less_than`, Value: `17`
Sample Event:
```json theme={null}
{
"event_id": "call_1",
"customer_id": "cus_123",
"event_name": "api.call",
"metadata": {
"plan_type": "premium",
"hour": 14,
"endpoint": "/v1/analytics"
}
}
```
Result: Premium API calls during business hours (9 AM to 5 PM) are counted.
## Troubleshooting
Resolve common issues with usage-based billing implementation and ensure accurate tracking and billing.
### Common Issues
Most usage-based billing problems fall into these categories:
* Event delivery and processing issues
* Meter configuration problems
* Data type and formatting errors
* Customer ID and authentication issues
### Debugging Steps
When troubleshooting usage-based billing:
1. Verify event delivery in the Events analytics tab
2. Check that meter configuration matches your event structure
3. Validate customer IDs and API authentication
4. Review filtering conditions and aggregation settings
### Solutions and Fixes
Common causes:
* Event name doesn't exactly match meter configuration
* Event filtering conditions are excluding your events
* Customer ID doesn't exist in your Dodo Payments account
* Event timestamp is outside the current billing period
Solutions:
* Verify event name spelling and case sensitivity
* Review and test your filtering conditions
* Confirm customer ID is valid and active
* Check that event timestamps are recent and properly formatted
Common causes:
* Over Property name doesn't match event metadata keys
* Metadata values are the wrong data type (string vs number)
* Missing required metadata properties
Solutions:
* Ensure metadata keys exactly match your Over Property setting
* Convert string numbers to actual numbers in your events
* Include all required properties in every event
Common causes:
* Filter property names don't match event metadata
* Wrong comparator for data type (string vs number)
* Case sensitivity in string comparisons
Solutions:
* Double-check that property names match exactly
* Use appropriate comparators for your data types
* Consider case sensitivity when filtering strings
## Related API Reference
API reference for creating and configuring usage meters for tracking customer consumption.
API reference for sending usage events to your configured meters for billing calculations.
This documentation is built and hosted on [Mintlify](https://mintlify.com), a developer documentation platform.
The Events tab provides granular visibility into individual usage events:
#### Event Information Display
The events table provides a clear view of individual usage events with the following columns:
* **Event Name**: The specific action or trigger that generated the usage event
* **Event ID**: A unique identifier for each event instance
* **Customer ID**: The customer associated with the event
* **Timestamp**: When the event occurred
This view allows you to track and monitor individual usage events across your customer base, providing transparency into billing calculations and usage patterns.
### Customer Analytics
The Customers tab provides a detailed table view of customer usage data with the following information:
#### Available Data Columns
The email address of the customer for identification.
A unique identifier for the customer's subscription.
Number of free units included in the customer's plan before charges apply.
The cost per unit for usage beyond the free threshold.
Timestamp of the customer's most recent usage event.
Total amount charged to the customer for usage-based billing.
Total number of units the customer has consumed.
Number of units that exceed the free threshold and are being charged.
#### Table Features
* **Column Filtering**: Use the "Edit Columns" feature to show or hide specific data columns
* **Real-time Updates**: Usage data reflects the most current consumption metrics
## Aggregation Examples
Here are practical examples of how different aggregation types work:
### Understanding Aggregation Types
Different aggregation types serve different billing scenarios. Choose the right type based on how you want to measure and charge for usage.
### Practical Implementation Examples
These examples demonstrate real-world applications of each aggregation type with sample events and expected results:
Scenario: Track the total number of API requests
Meter Configuration:
* Event Name: `api.call`
* Aggregation Type: Count
* Measurement Unit: `calls`
**Sample Events**:
```json theme={null}
{
"events": [
{"event_id": "call_1", "customer_id": "cus_123", "event_name": "api.call"},
{"event_id": "call_2", "customer_id": "cus_123", "event_name": "api.call"},
{"event_id": "call_3", "customer_id": "cus_123", "event_name": "api.call"}
]
}
```
Result: 3 calls billed to customer
Scenario: Bill based on total bytes transferred
Meter Configuration:
* Event Name: `data.transfer`
* Aggregation Type: Sum
* Over Property: `bytes`
* Measurement Unit: `GB`
**Sample Events**:
```json theme={null}
{
"events": [
{
"event_id": "transfer_1",
"customer_id": "cus_123",
"event_name": "data.transfer",
"metadata": {"bytes": 1073741824}
},
{
"event_id": "transfer_2",
"customer_id": "cus_123",
"event_name": "data.transfer",
"metadata": {"bytes": 536870912}
}
]
}
```
Result: 1.5 GB total transfer billed to customer
Scenario: Bill based on highest concurrent user count
Meter Configuration:
* Event Name: `concurrent.users`
* Aggregation Type: Max
* Over Property: `count`
* Measurement Unit: `users`
**Sample Events**:
```json theme={null}
{
"events": [
{
"event_id": "peak_1",
"customer_id": "cus_123",
"event_name": "concurrent.users",
"metadata": {"count": 15}
},
{
"event_id": "peak_2",
"customer_id": "cus_123",
"event_name": "concurrent.users",
"metadata": {"count": 23}
},
{
"event_id": "peak_3",
"customer_id": "cus_123",
"event_name": "concurrent.users",
"metadata": {"count": 18}
}
]
}
```
Result: 23 peak concurrent users billed to customer
### Event Filtering Examples
Only count API calls to specific endpoints:
Filter Configuration:
* Property: `endpoint`
* Comparator: `equals`
* Value: `/v1/orders`
Sample Event:
```json theme={null}
{
"event_id": "call_1",
"customer_id": "cus_123",
"event_name": "api.call",
"metadata": {
"endpoint": "/v1/orders",
"method": "POST"
}
}
```
Result: Events matching the filter criteria are counted. Events with different endpoints are ignored.
Only count large file uploads:
Filter Configuration:
* Property: `file_size`
* Comparator: `greater_than`
* Value: `1048576` (1 MB in bytes)
Sample Event:
```json theme={null}
{
"event_id": "upload_1",
"customer_id": "cus_123",
"event_name": "file.upload",
"metadata": {
"file_size": 5242880,
"file_type": "image"
}
}
```
Result: Files larger than 1 MB are counted. Smaller files are ignored.
Count premium API calls during business hours:
Filter Configuration (using AND logic):
* Property: `plan_type`, Comparator: `equals`, Value: `premium`
* Property: `hour`, Comparator: `greater_than_or_equals`, Value: `9`
* Property: `hour`, Comparator: `less_than`, Value: `17`
Sample Event:
```json theme={null}
{
"event_id": "call_1",
"customer_id": "cus_123",
"event_name": "api.call",
"metadata": {
"plan_type": "premium",
"hour": 14,
"endpoint": "/v1/analytics"
}
}
```
Result: Premium API calls during business hours (9 AM to 5 PM) are counted.
## Troubleshooting
Resolve common issues with usage-based billing implementation and ensure accurate tracking and billing.
### Common Issues
Most usage-based billing problems fall into these categories:
* Event delivery and processing issues
* Meter configuration problems
* Data type and formatting errors
* Customer ID and authentication issues
### Debugging Steps
When troubleshooting usage-based billing:
1. Verify event delivery in the Events analytics tab
2. Check that meter configuration matches your event structure
3. Validate customer IDs and API authentication
4. Review filtering conditions and aggregation settings
### Solutions and Fixes
Common causes:
* Event name doesn't exactly match meter configuration
* Event filtering conditions are excluding your events
* Customer ID doesn't exist in your Dodo Payments account
* Event timestamp is outside the current billing period
Solutions:
* Verify event name spelling and case sensitivity
* Review and test your filtering conditions
* Confirm customer ID is valid and active
* Check that event timestamps are recent and properly formatted
Common causes:
* Over Property name doesn't match event metadata keys
* Metadata values are the wrong data type (string vs number)
* Missing required metadata properties
Solutions:
* Ensure metadata keys exactly match your Over Property setting
* Convert string numbers to actual numbers in your events
* Include all required properties in every event
Common causes:
* Filter property names don't match event metadata
* Wrong comparator for data type (string vs number)
* Case sensitivity in string comparisons
Solutions:
* Double-check that property names match exactly
* Use appropriate comparators for your data types
* Consider case sensitivity when filtering strings
## Related API Reference
API reference for creating and configuring usage meters for tracking customer consumption.
API reference for sending usage events to your configured meters for billing calculations.
This documentation is built and hosted on [Mintlify](https://mintlify.com), a developer documentation platform.