> ## Documentation Index
> Fetch the complete documentation index at: https://docs.dodopayments.com/llms.txt
> Use this file to discover all available pages before exploring further.
# Dashboard Analytics
> Track revenue, customers, subscriptions, retention, payment success, and recovery in the Dodo Payments dashboard, for your whole business or for one product.
 ## Introduction
Dashboard analytics show how your business performs: revenue, customers, subscriptions, retention, payment success, and recovered revenue. **Home** gives you a quick daily view. **Analytics** holds the full set of metrics, with filters for period, comparison, and product.
Today's activity (**Today**) plus an overview you can customize.
Revenue, customers, subscriptions, retention, transaction health, and recovery across your business.
The same metrics for one product: revenue, customers, churn, subscribers, and MRR.
Summary metrics at the top of your products, subscriptions, payments, and other list pages.
Reconcile your balance, review every fee, and export any date range as CSV or XLSX.
## Introduction
Dashboard analytics show how your business performs: revenue, customers, subscriptions, retention, payment success, and recovered revenue. **Home** gives you a quick daily view. **Analytics** holds the full set of metrics, with filters for period, comparison, and product.
Today's activity (**Today**) plus an overview you can customize.
Revenue, customers, subscriptions, retention, transaction health, and recovery across your business.
The same metrics for one product: revenue, customers, churn, subscribers, and MRR.
Summary metrics at the top of your products, subscriptions, payments, and other list pages.
Reconcile your balance, review every fee, and export any date range as CSV or XLSX.
 ## Home
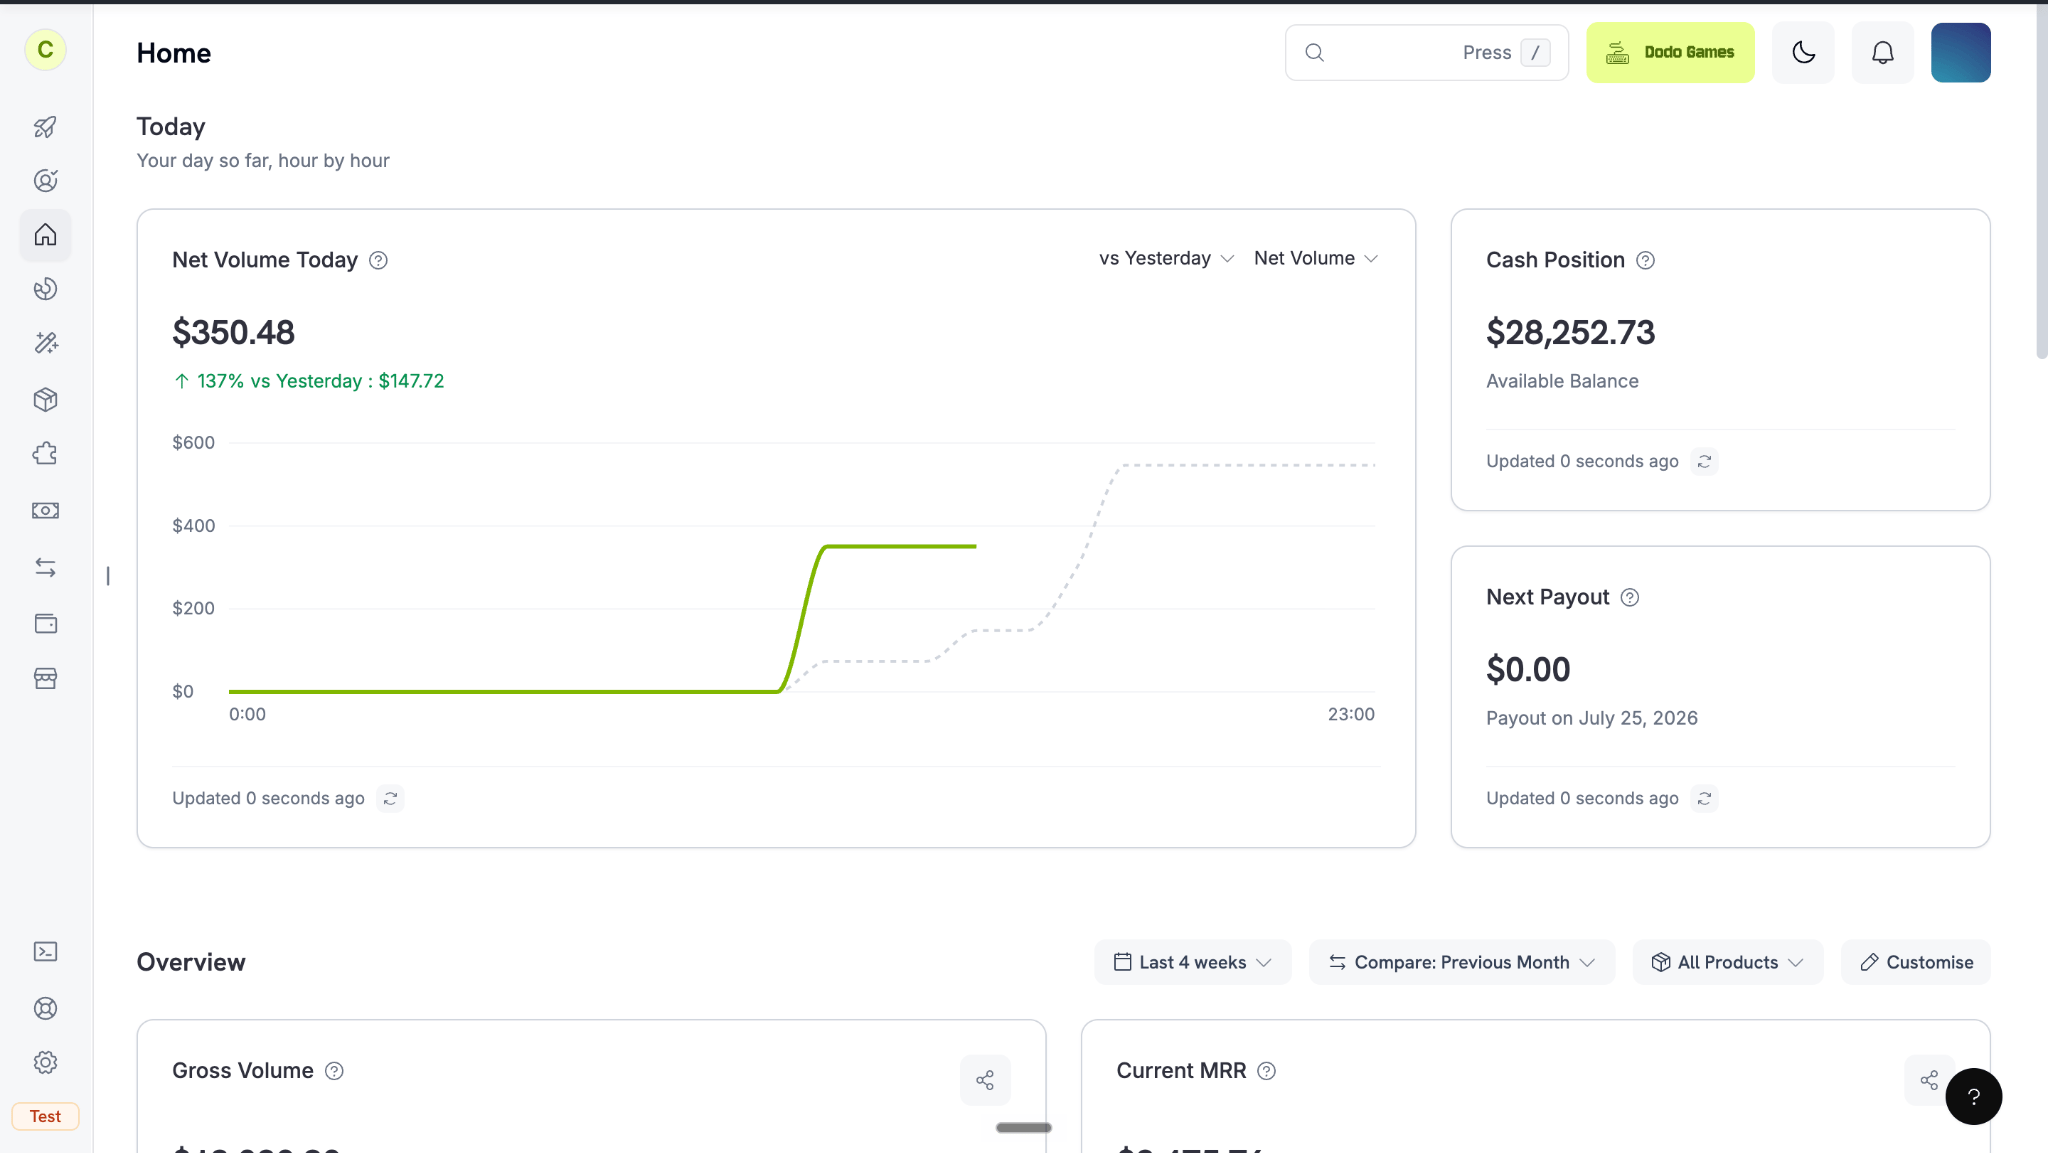
**Home** is your landing page in the sidebar. It has two sections: **Today** and **Overview**.
### Today
## Home
**Home** is your landing page in the sidebar. It has two sections: **Today** and **Overview**.
### Today
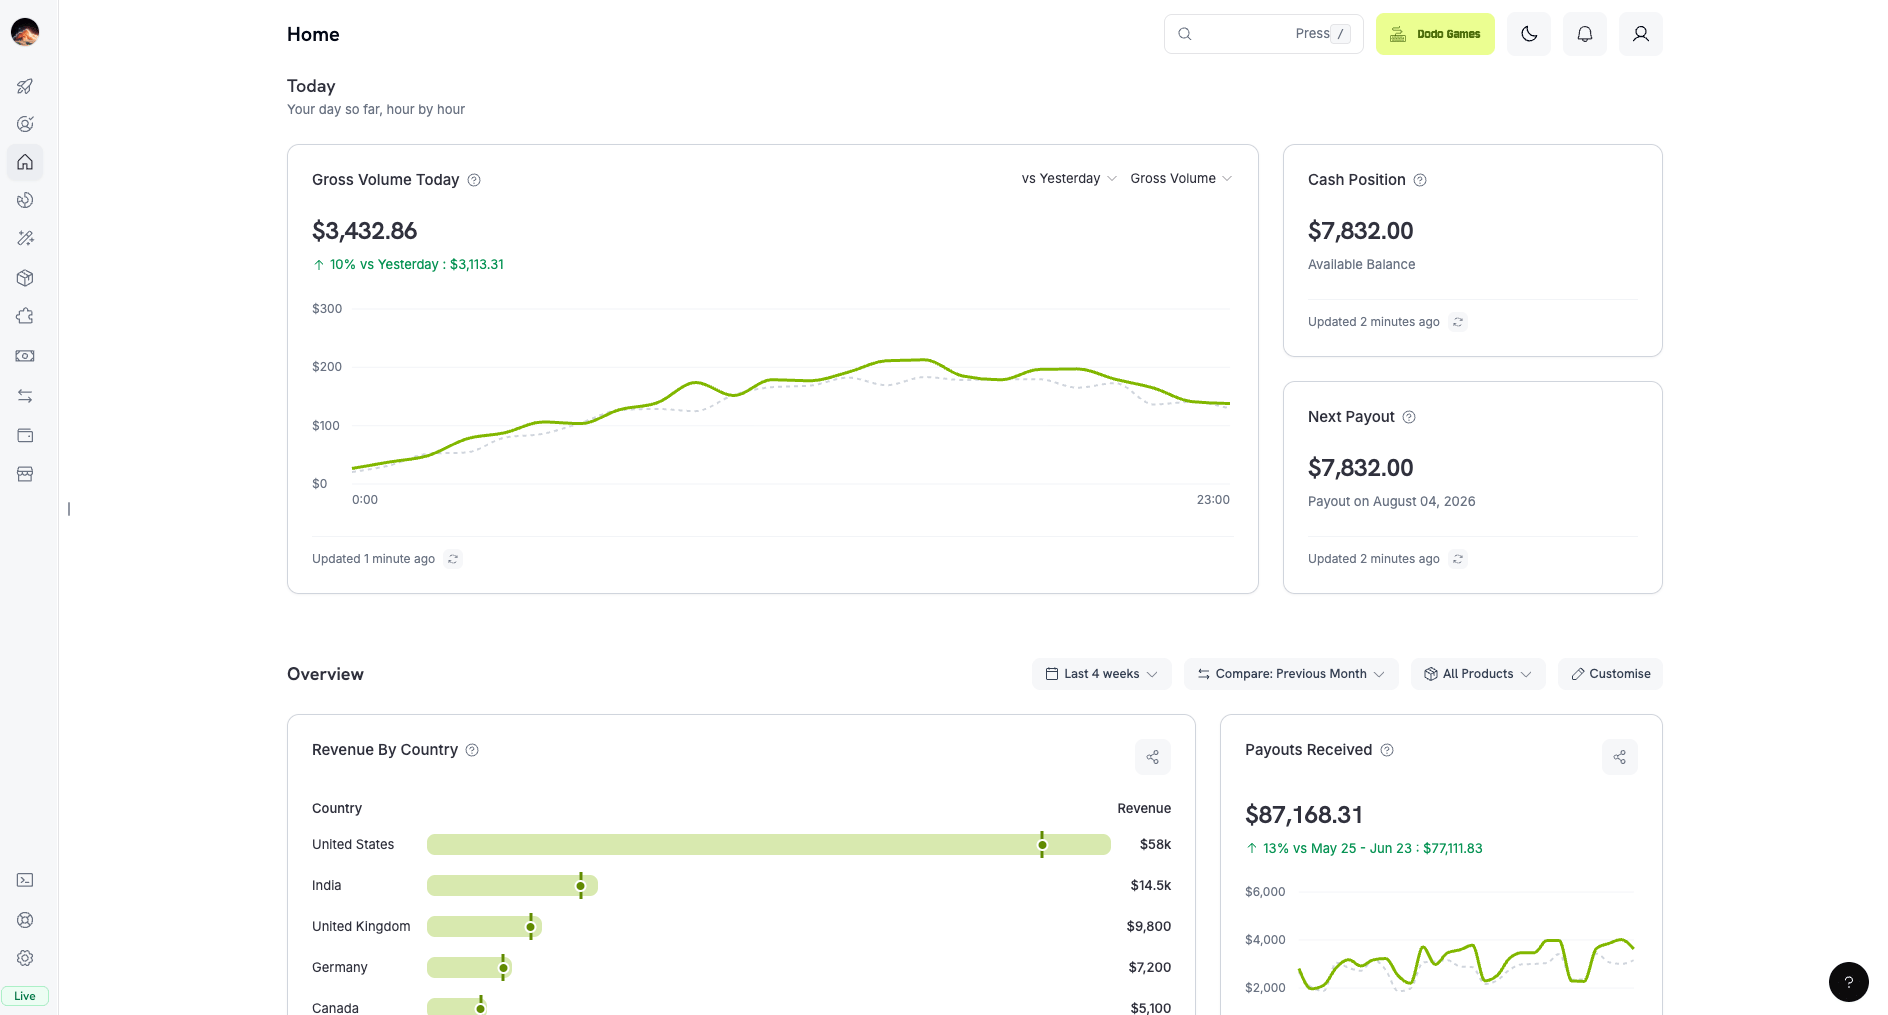 **Today** shows the current day's activity, hour by hour.
* **Headline chart:** Switch between **Net Volume** and **Gross Volume**. It defaults to **Net Volume** and plots each hour against the same hour yesterday. To compare against a different day, pick a date.
* **Cash Position:** The funds available in your balance. It follows the mode you're in, so test mode and live mode show different balances.
* **Next Payout:** The amount and date of your next payout. It always shows live mode data, even in test mode.
Each card has an info tooltip (ⓘ) and an "Updated" timestamp, so you can see how recent the data is.
### Your Overview
**Today** shows the current day's activity, hour by hour.
* **Headline chart:** Switch between **Net Volume** and **Gross Volume**. It defaults to **Net Volume** and plots each hour against the same hour yesterday. To compare against a different day, pick a date.
* **Cash Position:** The funds available in your balance. It follows the mode you're in, so test mode and live mode show different balances.
* **Next Payout:** The amount and date of your next payout. It always shows live mode data, even in test mode.
Each card has an info tooltip (ⓘ) and an "Updated" timestamp, so you can see how recent the data is.
### Your Overview
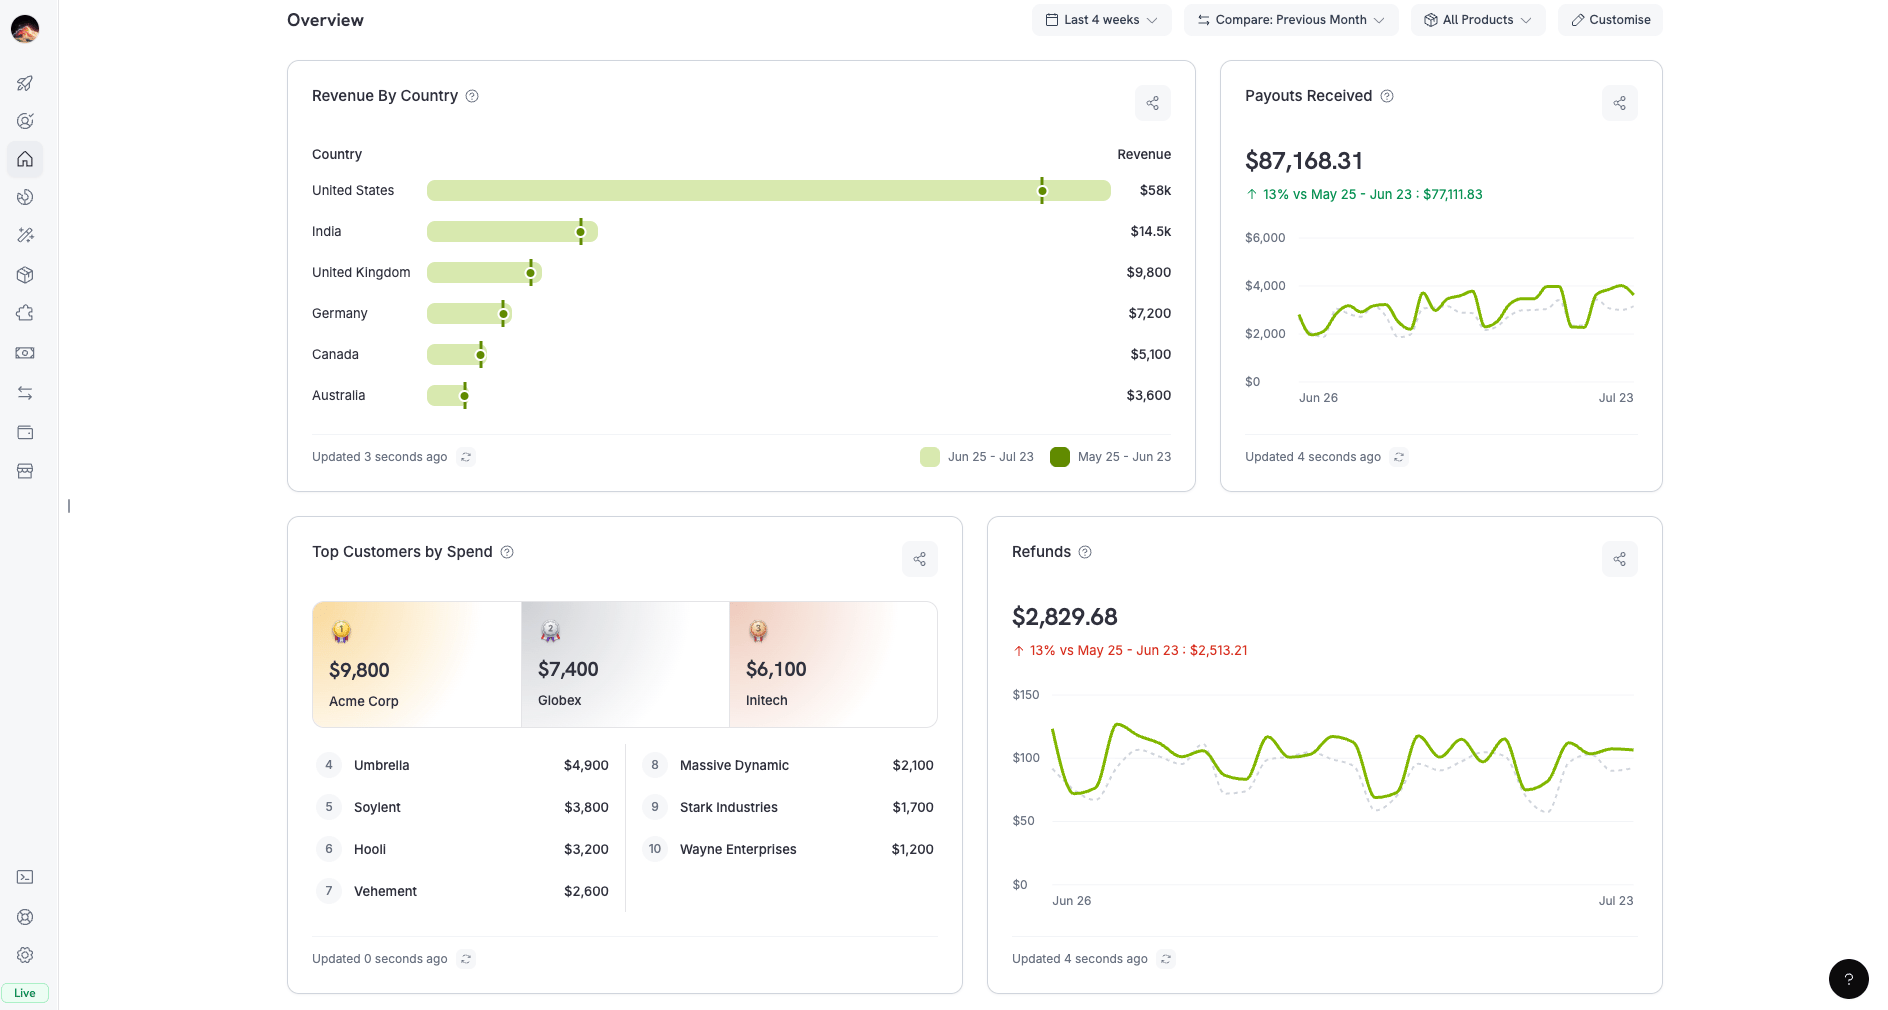 **Overview** is a grid of metric cards you choose. To change it, click **Customise**. In **Customise Your Layout**, you can drag cards to reorder them, remove cards, and select which metrics each section shows. Your layout is saved for each business.
* **Default cards:** **Gross Volume**, **Net Volume**, **Refunds**, **New Customers**, **Top Customers by Spend**, **Average Order Value**, **Revenue By Country**, and **Payment Success Rate**.
* **Controls:**
* **Period:** A preset range such as **Last 30 days**, or a custom date range.
* **Compare:** **Previous Period** (the default), **Previous Week**, **Previous Month**, or **Previous Year**.
* **Product:** One or more products. Defaults to **All Products**.
## Analytics
Open **Analytics** from the sidebar, directly below **Home**, to analyze your entire business. It has six tabs, and each tab has its own filters.
Gross and net volume, payouts, refunds, disputes, and top markets.
Active and new customers, ARPU, top customers, and modeled LTV.
MRR, Projected ARR, active subscriptions, and the full MRR breakdown.
Customer and revenue churn, NRR and GRR, cohorts, and trial conversion.
Payment and refund success rates with failure-reason analysis.
Payment retries, dunning, and abandoned cart recovery performance.
### Filtering & Customization
Each tab has a filter bar with three controls:
* **Time Period:** A preset range (**Today**, **Last 7 days**, **Last 30 days**, **Month to date**, **Quarter to date**, **Last 6 months**, or **All time**) or a custom date range. New dashboards start on **Last 30 days**.
* **Compare:** **Previous Period** (the default), **Previous Week**, **Previous Month**, or **Previous Year**. Comparison is unavailable on **All time**, because there is no earlier window to compare against.
* **Product:** Multi-select, defaults to **All Products**. It filters the Revenue, Customers, Subscriptions, and Retention tabs. **Payouts Received**, **Refunds**, **Disputes**, and most Success Rate and Recovery cards always cover every product.
Dodo Payments remembers your date range and compare selections for each business and syncs them to your profile. Switching businesses, returning later, or signing in on another device keeps each business on the window you last used. The product filter isn't saved and resets in each session.
Use filters to focus on specific products or time periods.
### Revenue Tab
**Overview** is a grid of metric cards you choose. To change it, click **Customise**. In **Customise Your Layout**, you can drag cards to reorder them, remove cards, and select which metrics each section shows. Your layout is saved for each business.
* **Default cards:** **Gross Volume**, **Net Volume**, **Refunds**, **New Customers**, **Top Customers by Spend**, **Average Order Value**, **Revenue By Country**, and **Payment Success Rate**.
* **Controls:**
* **Period:** A preset range such as **Last 30 days**, or a custom date range.
* **Compare:** **Previous Period** (the default), **Previous Week**, **Previous Month**, or **Previous Year**.
* **Product:** One or more products. Defaults to **All Products**.
## Analytics
Open **Analytics** from the sidebar, directly below **Home**, to analyze your entire business. It has six tabs, and each tab has its own filters.
Gross and net volume, payouts, refunds, disputes, and top markets.
Active and new customers, ARPU, top customers, and modeled LTV.
MRR, Projected ARR, active subscriptions, and the full MRR breakdown.
Customer and revenue churn, NRR and GRR, cohorts, and trial conversion.
Payment and refund success rates with failure-reason analysis.
Payment retries, dunning, and abandoned cart recovery performance.
### Filtering & Customization
Each tab has a filter bar with three controls:
* **Time Period:** A preset range (**Today**, **Last 7 days**, **Last 30 days**, **Month to date**, **Quarter to date**, **Last 6 months**, or **All time**) or a custom date range. New dashboards start on **Last 30 days**.
* **Compare:** **Previous Period** (the default), **Previous Week**, **Previous Month**, or **Previous Year**. Comparison is unavailable on **All time**, because there is no earlier window to compare against.
* **Product:** Multi-select, defaults to **All Products**. It filters the Revenue, Customers, Subscriptions, and Retention tabs. **Payouts Received**, **Refunds**, **Disputes**, and most Success Rate and Recovery cards always cover every product.
Dodo Payments remembers your date range and compare selections for each business and syncs them to your profile. Switching businesses, returning later, or signing in on another device keeps each business on the window you last used. The product filter isn't saved and resets in each session.
Use filters to focus on specific products or time periods.
### Revenue Tab
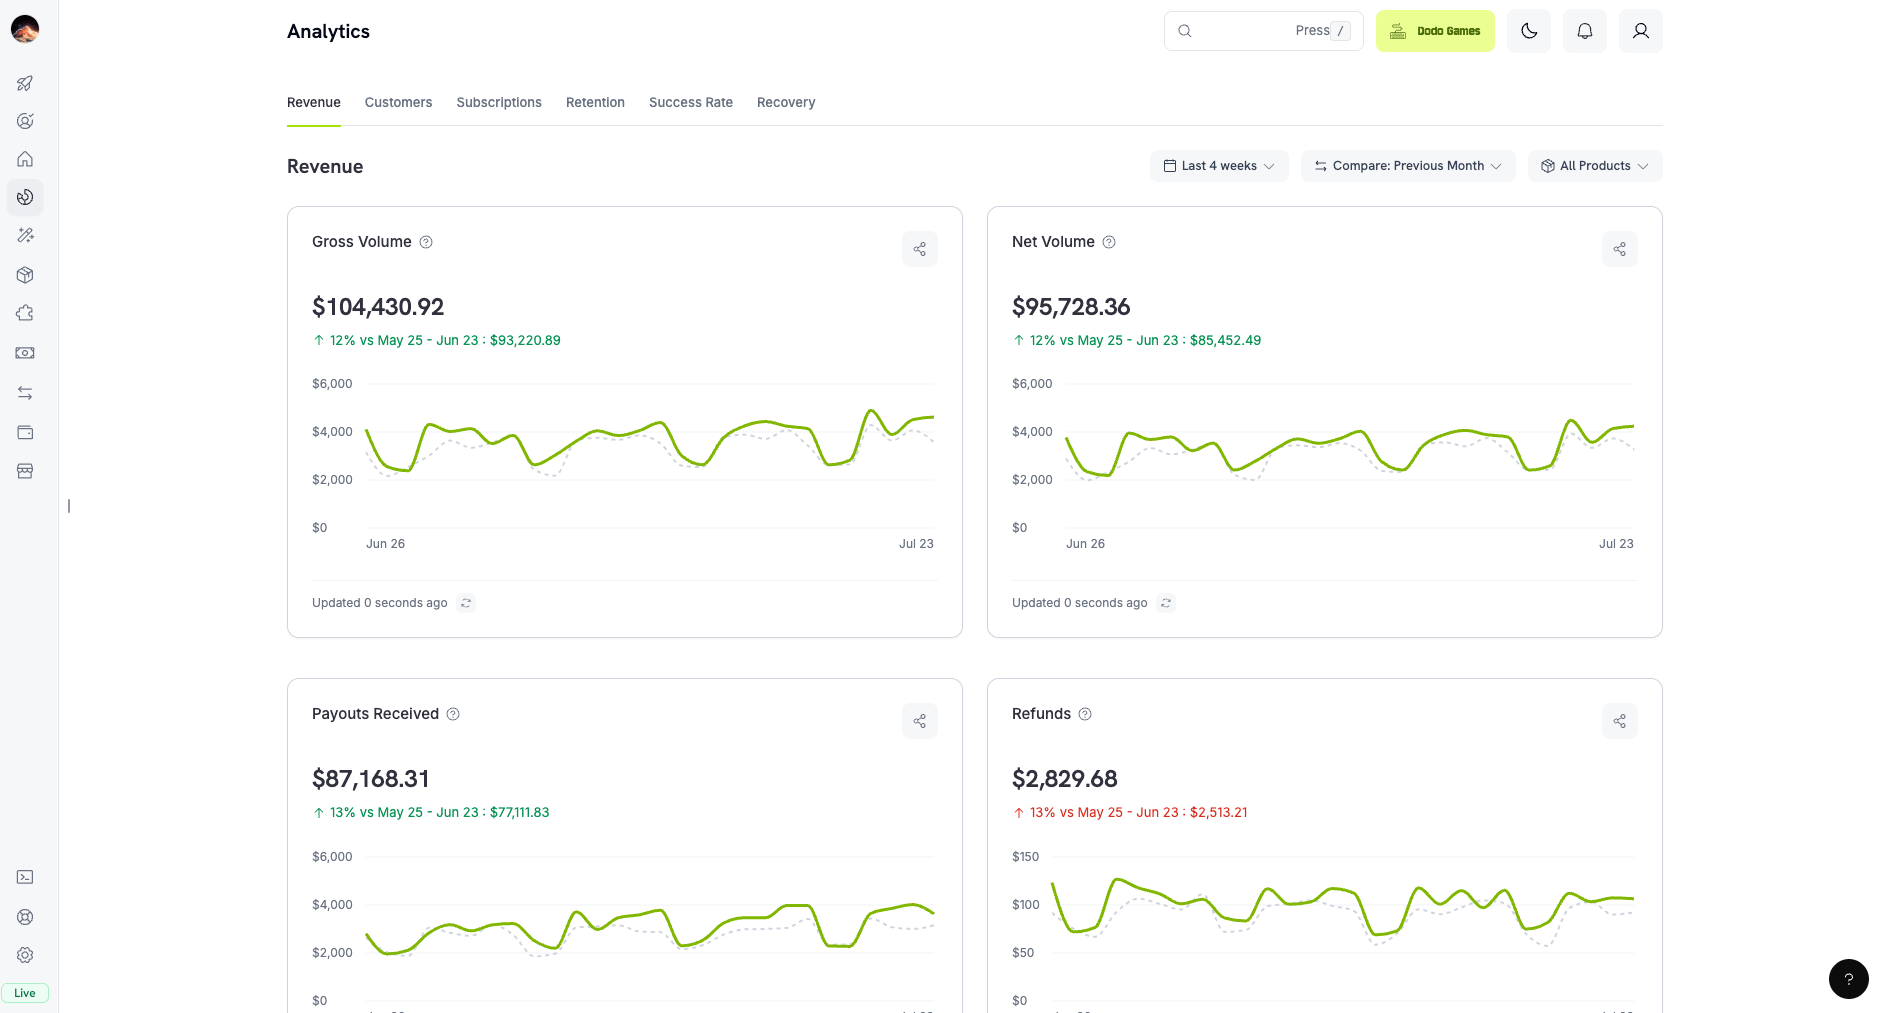 Track income, payouts, and dispute activity to see revenue trends and your top markets.
| Metric | Description |
| - | - |
| **Gross Volume** | Total amount charged across all successful payments in the period, before fees, refunds, or disputes are removed. |
| **Net Volume** | Net volume = gross volume − fees − refunds − lost disputes. |
| **Payouts Received** | Payout = eligible sales − taxes − fees − refunds − chargebacks. |
| **Refunds** | Refund rate = refunded amount ÷ gross volume. |
| **Disputes** | The headline is the chargeback rate, gross of outcome. Every chargeback received counts, so chargebacks you later win, or that are withdrawn, don't lower it. Card networks judge risk the same way. Won, lost, and pending disputes are shown as counts for context and compared across the two periods. Chargeback rate = chargebacks received ÷ payments. |
| **Payments Count** | Count of payments with a Successful status. In-progress, failed, and not-initiated attempts are excluded. |
| **Payments Breakdown** | Splits attempts into total, success, failed (network), failed (customer), and not initiated. |
| **Average Order Value** | AOV = revenue ÷ number of orders, across one-time and usage-based products. |
| **Revenue by Product** | Gross revenue attributed to each product, ranked from highest to lowest. |
| **Revenue By Country** | Revenue attributed to each country, based on the customer's billing country. A full-width card pairs a world map with the ranked country list, and darker countries earned more. The top 150 countries are listed individually, and any remaining countries are grouped into one "Others" row. |
### Customers Tab
Track income, payouts, and dispute activity to see revenue trends and your top markets.
| Metric | Description |
| - | - |
| **Gross Volume** | Total amount charged across all successful payments in the period, before fees, refunds, or disputes are removed. |
| **Net Volume** | Net volume = gross volume − fees − refunds − lost disputes. |
| **Payouts Received** | Payout = eligible sales − taxes − fees − refunds − chargebacks. |
| **Refunds** | Refund rate = refunded amount ÷ gross volume. |
| **Disputes** | The headline is the chargeback rate, gross of outcome. Every chargeback received counts, so chargebacks you later win, or that are withdrawn, don't lower it. Card networks judge risk the same way. Won, lost, and pending disputes are shown as counts for context and compared across the two periods. Chargeback rate = chargebacks received ÷ payments. |
| **Payments Count** | Count of payments with a Successful status. In-progress, failed, and not-initiated attempts are excluded. |
| **Payments Breakdown** | Splits attempts into total, success, failed (network), failed (customer), and not initiated. |
| **Average Order Value** | AOV = revenue ÷ number of orders, across one-time and usage-based products. |
| **Revenue by Product** | Gross revenue attributed to each product, ranked from highest to lowest. |
| **Revenue By Country** | Revenue attributed to each country, based on the customer's billing country. A full-width card pairs a world map with the ranked country list, and darker countries earned more. The top 150 countries are listed individually, and any remaining countries are grouped into one "Others" row. |
### Customers Tab
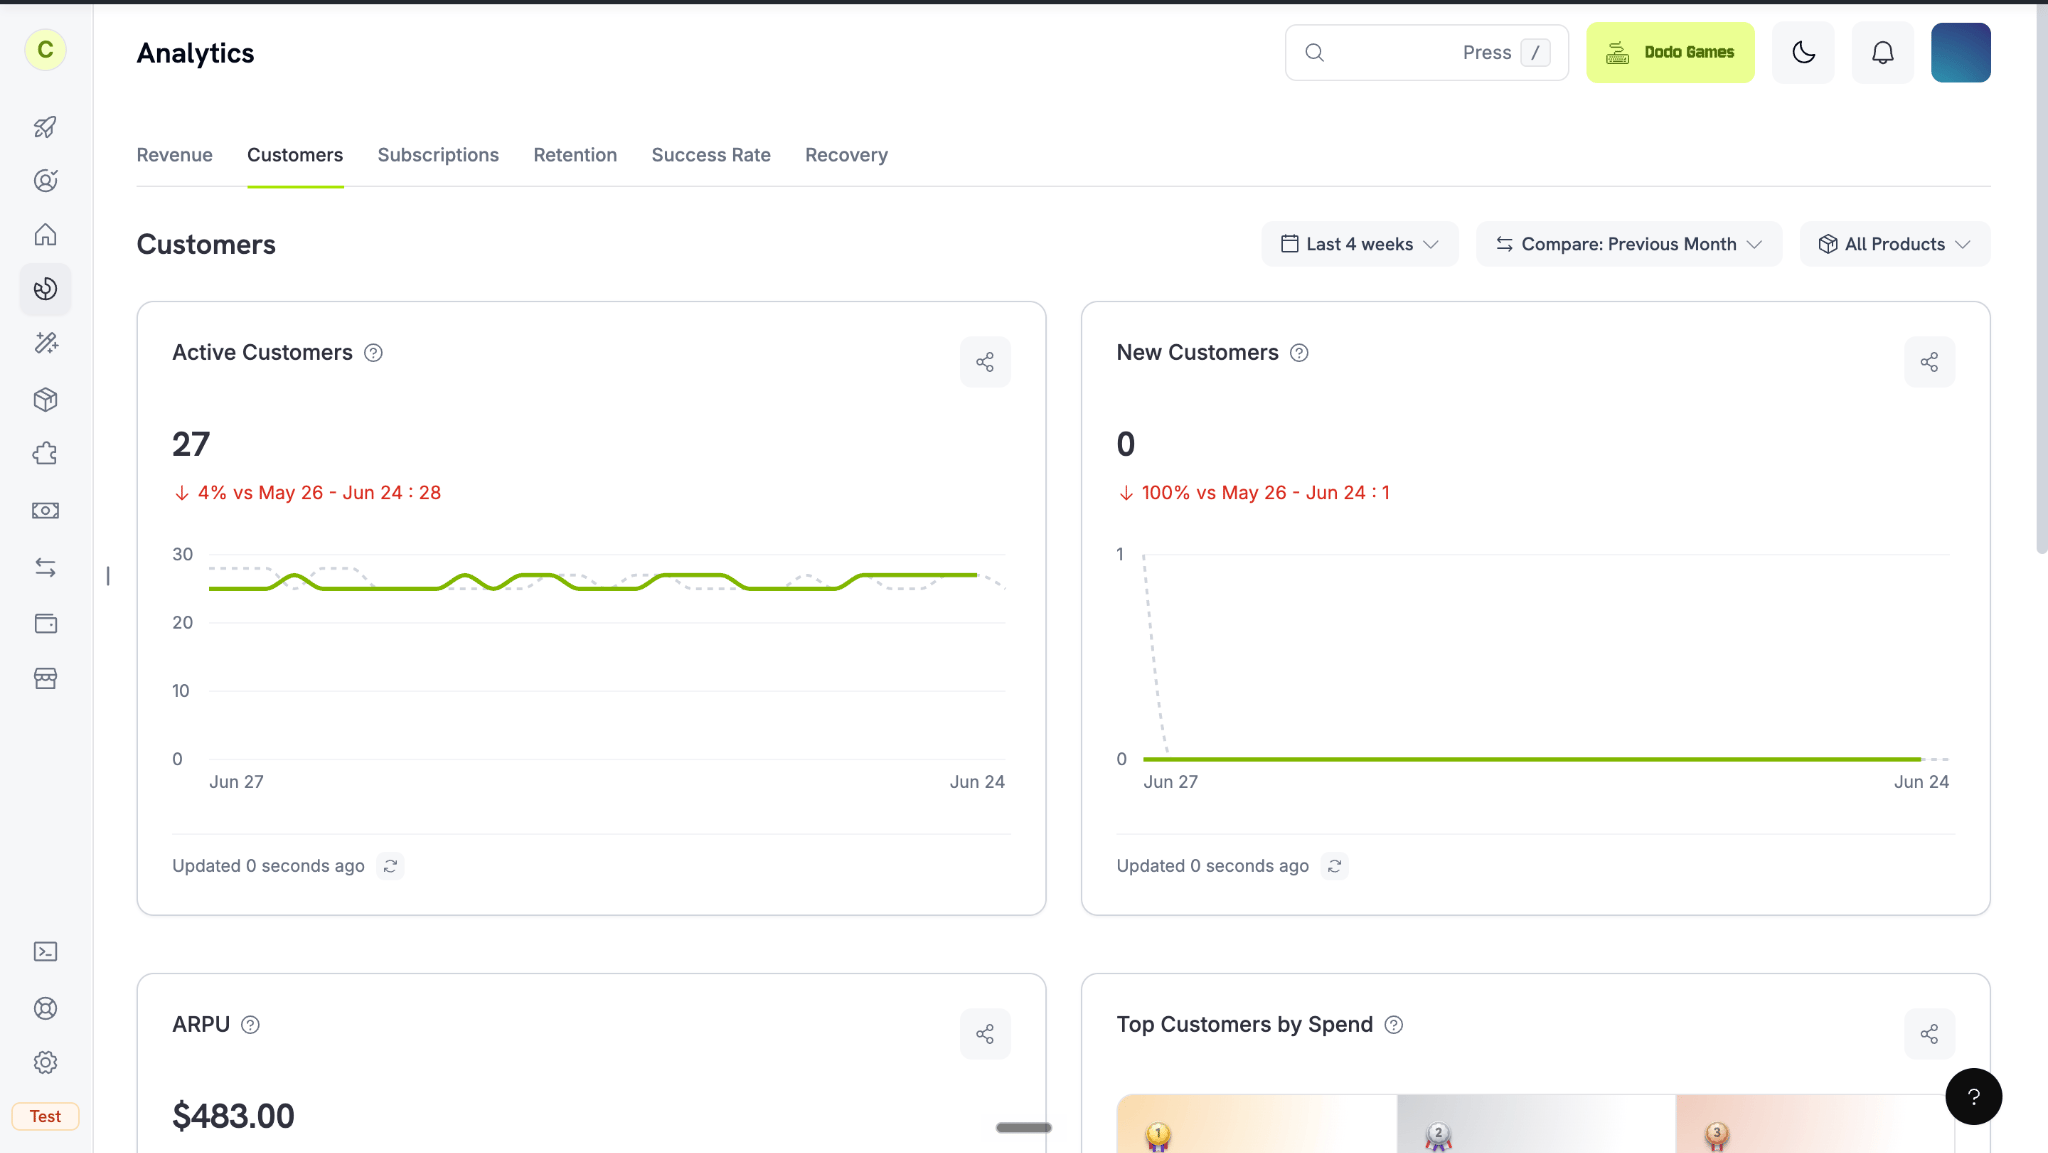 Analyze customer acquisition, retention, and spending patterns.
| Metric | Description |
| - | - |
| **Active Customers** | Customers who made a payment or held an active subscription at any point in the period. |
| **New Customers** | Customers whose first successful payment with you falls in this period. |
| **ARPU** | ARPU = revenue ÷ active customers. |
| **Top Customers by Spend** | Customers ranked by revenue in the period, highest first. Each entry shows the customer's name, or their email address when no name is on record. |
| **New VS Returning** | New = first purchase in this period. Returning = purchased with you in an earlier period. |
| **LTV (model)** | Modeled revenue from a customer before they churn. LTV = ARPU ÷ subscriber churn rate, with both on a monthly basis. |
### Subscriptions Tab
Monitor your recurring revenue and see how your Monthly Recurring Revenue (MRR) changes over time.
| Metric | Description |
| - | - |
| **Current MRR** | Recurring revenue expected in a month, with every plan converted to monthly (a yearly plan counts as 1/12). One-time payments are excluded. |
| **Projected ARR** | Projected ARR = current MRR × 12. |
| **Net New MRR** | Net New MRR = New + Expansion − Contraction − Churned. |
| **Active Subscriptions** | Subscriptions that are billing, including those still in a trial. |
| **New MRR** | MRR added by brand-new subscriptions in the period. |
| **Expansion MRR** | Extra MRR from existing customers upgrading or buying add-ons. |
| **Contraction MRR** | MRR lost when existing customers move to a cheaper plan but stay subscribed. |
| **Churned MRR** | MRR lost when customers cancel their subscriptions in the period. |
MRR counts each subscription separately, so a customer with **concurrent subscriptions** adds all of them. Each subscription adds its recurring amount, including add-ons, converted to a monthly rate. Trials add nothing until they convert, and usage-based subscriptions add only their fixed base price.
### Retention Tab
Analyze customer acquisition, retention, and spending patterns.
| Metric | Description |
| - | - |
| **Active Customers** | Customers who made a payment or held an active subscription at any point in the period. |
| **New Customers** | Customers whose first successful payment with you falls in this period. |
| **ARPU** | ARPU = revenue ÷ active customers. |
| **Top Customers by Spend** | Customers ranked by revenue in the period, highest first. Each entry shows the customer's name, or their email address when no name is on record. |
| **New VS Returning** | New = first purchase in this period. Returning = purchased with you in an earlier period. |
| **LTV (model)** | Modeled revenue from a customer before they churn. LTV = ARPU ÷ subscriber churn rate, with both on a monthly basis. |
### Subscriptions Tab
Monitor your recurring revenue and see how your Monthly Recurring Revenue (MRR) changes over time.
| Metric | Description |
| - | - |
| **Current MRR** | Recurring revenue expected in a month, with every plan converted to monthly (a yearly plan counts as 1/12). One-time payments are excluded. |
| **Projected ARR** | Projected ARR = current MRR × 12. |
| **Net New MRR** | Net New MRR = New + Expansion − Contraction − Churned. |
| **Active Subscriptions** | Subscriptions that are billing, including those still in a trial. |
| **New MRR** | MRR added by brand-new subscriptions in the period. |
| **Expansion MRR** | Extra MRR from existing customers upgrading or buying add-ons. |
| **Contraction MRR** | MRR lost when existing customers move to a cheaper plan but stay subscribed. |
| **Churned MRR** | MRR lost when customers cancel their subscriptions in the period. |
MRR counts each subscription separately, so a customer with **concurrent subscriptions** adds all of them. Each subscription adds its recurring amount, including add-ons, converted to a monthly rate. Trials add nothing until they convert, and usage-based subscriptions add only their fixed base price.
### Retention Tab
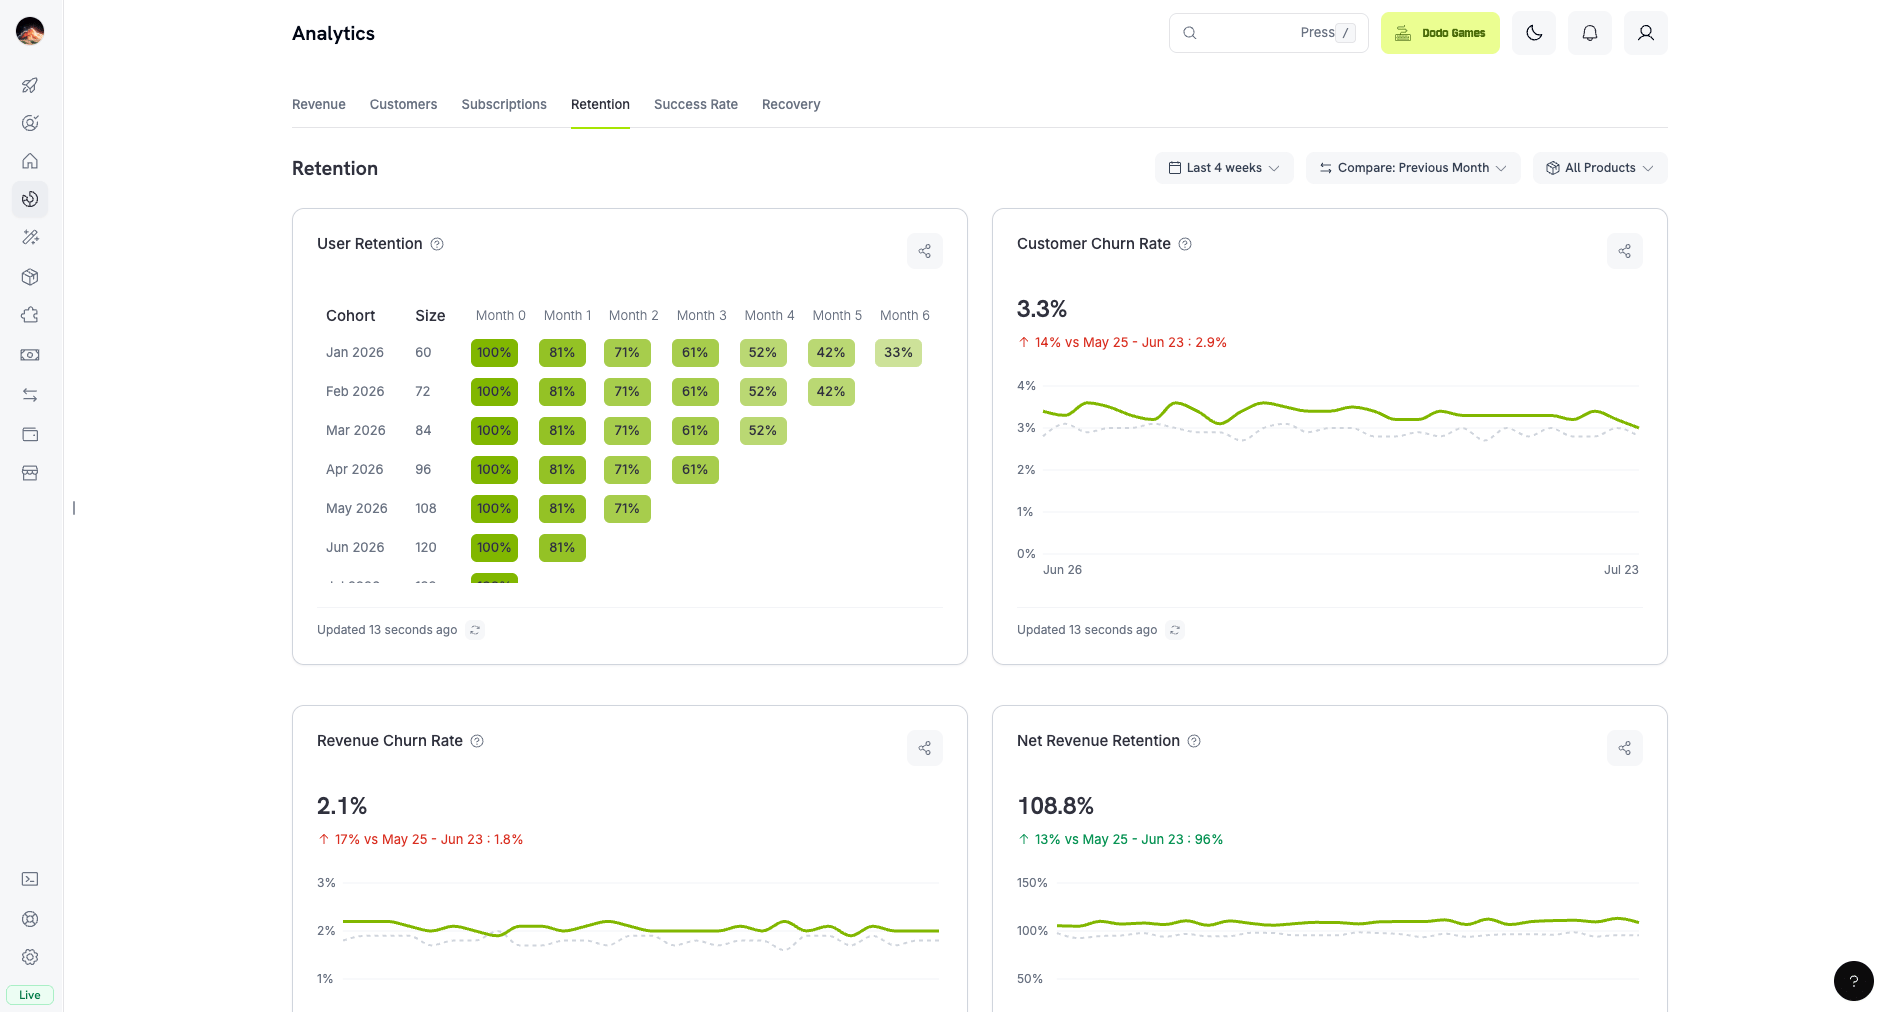 Monitor customer retention and churn patterns.
| Metric | Description |
| - | - |
| **User Retention** | Groups customers by signup month (cohort), then shows the share of each cohort still active in every later month. Retention (month k) = cohort customers active in month k ÷ cohort size. |
| **Customer Churn Rate** | Share of starting subscribers who cancelled during the period, with the churned-customer count beside it. Customer churn rate = churned subscribers ÷ subscribers at start of period. |
| **Revenue Churn Rate** | Revenue churn rate = churned MRR ÷ starting MRR. Starting MRR is the recurring revenue from existing customers at the start of the period, which is where the prior period ended. |
| **Net Revenue Retention (NRR)** | Includes upgrades, so it can exceed 100%. NRR = (starting MRR + Expansion − Contraction − Churned) ÷ starting MRR. |
| **Gross Revenue Retention (GRR)** | Excludes upgrades, so it caps at 100%. GRR = (starting MRR − Contraction − Churned) ÷ starting MRR. |
| **Trial Conversion** | Trial conversion = trials converted ÷ trials that ended in the period. |
### Success Rate Tab
Monitor customer retention and churn patterns.
| Metric | Description |
| - | - |
| **User Retention** | Groups customers by signup month (cohort), then shows the share of each cohort still active in every later month. Retention (month k) = cohort customers active in month k ÷ cohort size. |
| **Customer Churn Rate** | Share of starting subscribers who cancelled during the period, with the churned-customer count beside it. Customer churn rate = churned subscribers ÷ subscribers at start of period. |
| **Revenue Churn Rate** | Revenue churn rate = churned MRR ÷ starting MRR. Starting MRR is the recurring revenue from existing customers at the start of the period, which is where the prior period ended. |
| **Net Revenue Retention (NRR)** | Includes upgrades, so it can exceed 100%. NRR = (starting MRR + Expansion − Contraction − Churned) ÷ starting MRR. |
| **Gross Revenue Retention (GRR)** | Excludes upgrades, so it caps at 100%. GRR = (starting MRR − Contraction − Churned) ÷ starting MRR. |
| **Trial Conversion** | Trial conversion = trials converted ÷ trials that ended in the period. |
### Success Rate Tab
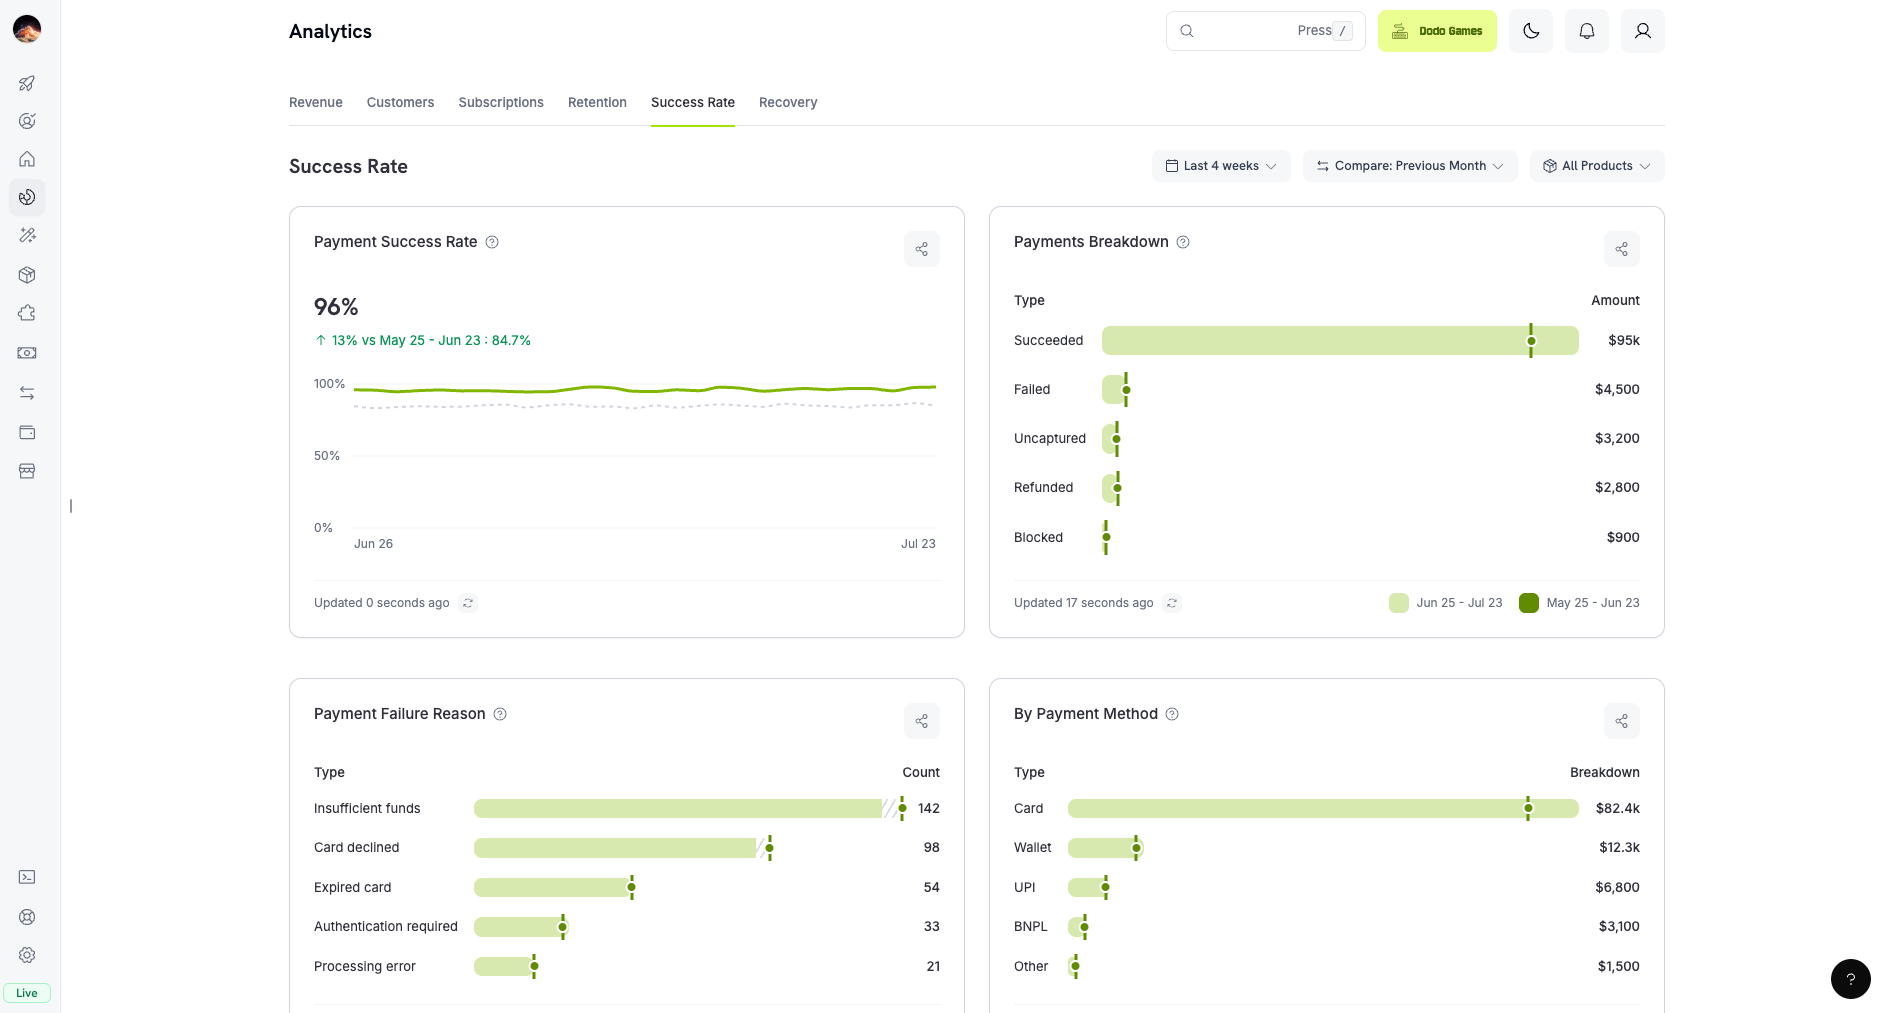 Monitor payment and refund success rates to find and resolve transaction issues.
| Metric | Description |
| - | - |
| **Payment Success Rate** | Only processor and network failures count against it. Customer-fixable failures, such as a wrong or expired card, are excluded from the denominator. Payment success rate = succeeded ÷ (attempts − customer-fixable failures). |
| **Payments Breakdown** | Splits attempts into total, success, failed (network), failed (customer), and not initiated. |
| **Payment Failure Reason** | Breakdown of payment failures by reason. |
| **By Payment Method** | Per method (card, wallet, UPI, BNPL): success rate = succeeded ÷ attempts, and volume = succeeded amount. |
| **Checkouts** | How many checkout sessions customers began, whether or not they completed them. |
| **Refund Success Rate** | The share of initiated refunds that processed successfully. |
All transaction failure codes and their reasons.
If success rates drop or failures spike, review the failure reasons and address them promptly to limit lost revenue.
### Recovery Tab
Monitor payment and refund success rates to find and resolve transaction issues.
| Metric | Description |
| - | - |
| **Payment Success Rate** | Only processor and network failures count against it. Customer-fixable failures, such as a wrong or expired card, are excluded from the denominator. Payment success rate = succeeded ÷ (attempts − customer-fixable failures). |
| **Payments Breakdown** | Splits attempts into total, success, failed (network), failed (customer), and not initiated. |
| **Payment Failure Reason** | Breakdown of payment failures by reason. |
| **By Payment Method** | Per method (card, wallet, UPI, BNPL): success rate = succeeded ÷ attempts, and volume = succeeded amount. |
| **Checkouts** | How many checkout sessions customers began, whether or not they completed them. |
| **Refund Success Rate** | The share of initiated refunds that processed successfully. |
All transaction failure codes and their reasons.
If success rates drop or failures spike, review the failure reasons and address them promptly to limit lost revenue.
### Recovery Tab
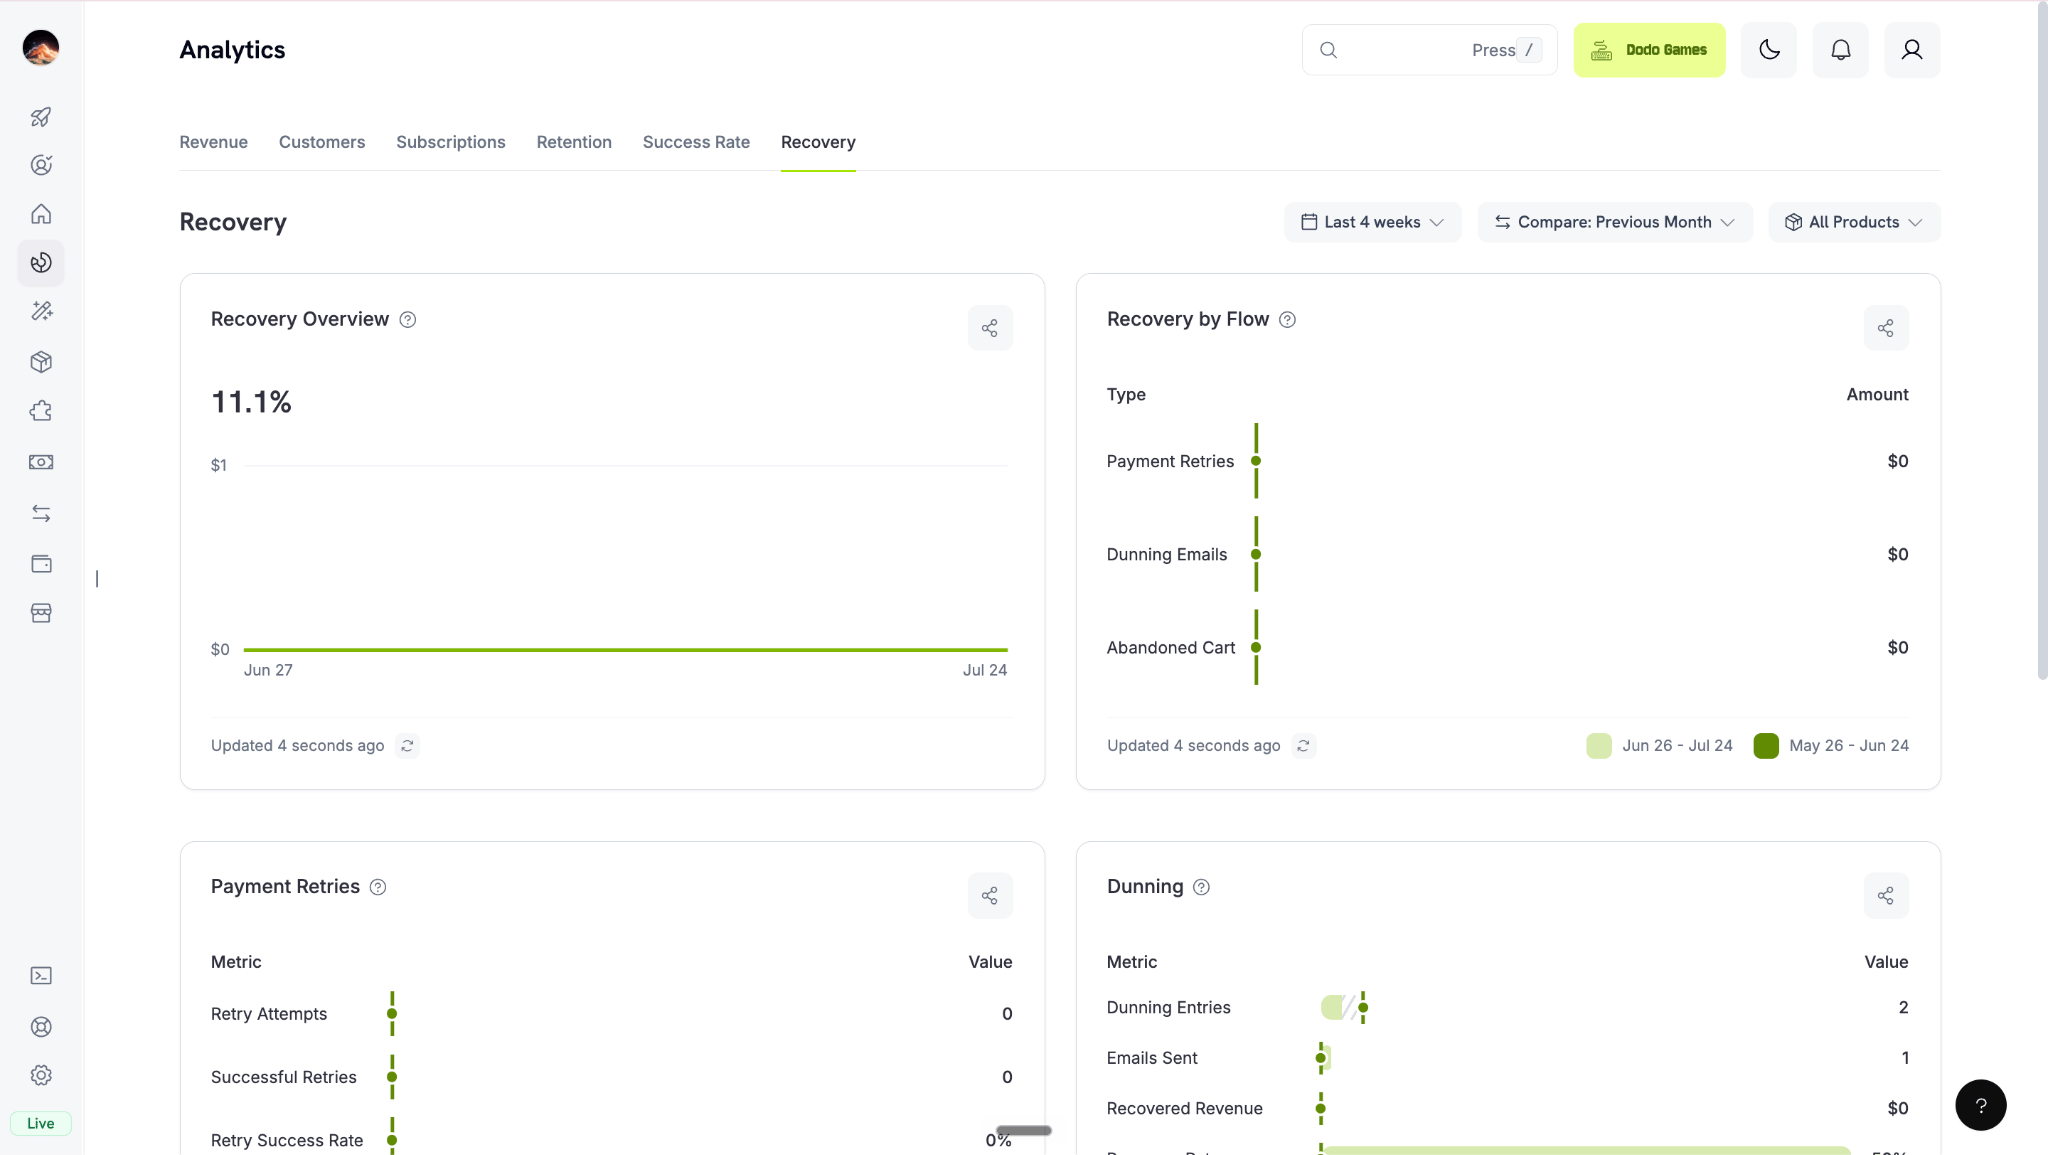 Track how much revenue Dodo Payments recovers for you through automated payment retries, dunning emails, and abandoned cart recovery.
| Metric | Description |
| - | - |
| **Recovery Overview** | Recovered revenue as a trend, with the overall recovery rate. Recovery rate = recovered ÷ recoverable failed amount. Hard declines, such as closed accounts, are excluded from the recoverable amount. |
| **Recovery by Flow** | Recovered revenue broken down across retries, dunning, and abandoned cart. |
| **Payment Retries** | Retry attempts, successful retries, retry success rate, and subscriptions saved. |
| **Dunning** | Dunning entries, emails sent, recovered revenue, recovery rate, and average time to recover. |
| **Abandoned Cart** | Abandoned checkouts, recovered revenue, recovery rate, and average time to recover. |
Configure payment retries, dunning, and abandoned cart recovery.
## Product-Level Analytics
To see analytics for one product, go to **Products** and select the product. The product page shows the same cards as **Analytics**, scoped to that product.
Track how much revenue Dodo Payments recovers for you through automated payment retries, dunning emails, and abandoned cart recovery.
| Metric | Description |
| - | - |
| **Recovery Overview** | Recovered revenue as a trend, with the overall recovery rate. Recovery rate = recovered ÷ recoverable failed amount. Hard declines, such as closed accounts, are excluded from the recoverable amount. |
| **Recovery by Flow** | Recovered revenue broken down across retries, dunning, and abandoned cart. |
| **Payment Retries** | Retry attempts, successful retries, retry success rate, and subscriptions saved. |
| **Dunning** | Dunning entries, emails sent, recovered revenue, recovery rate, and average time to recover. |
| **Abandoned Cart** | Abandoned checkouts, recovered revenue, recovery rate, and average time to recover. |
Configure payment retries, dunning, and abandoned cart recovery.
## Product-Level Analytics
To see analytics for one product, go to **Products** and select the product. The product page shows the same cards as **Analytics**, scoped to that product.
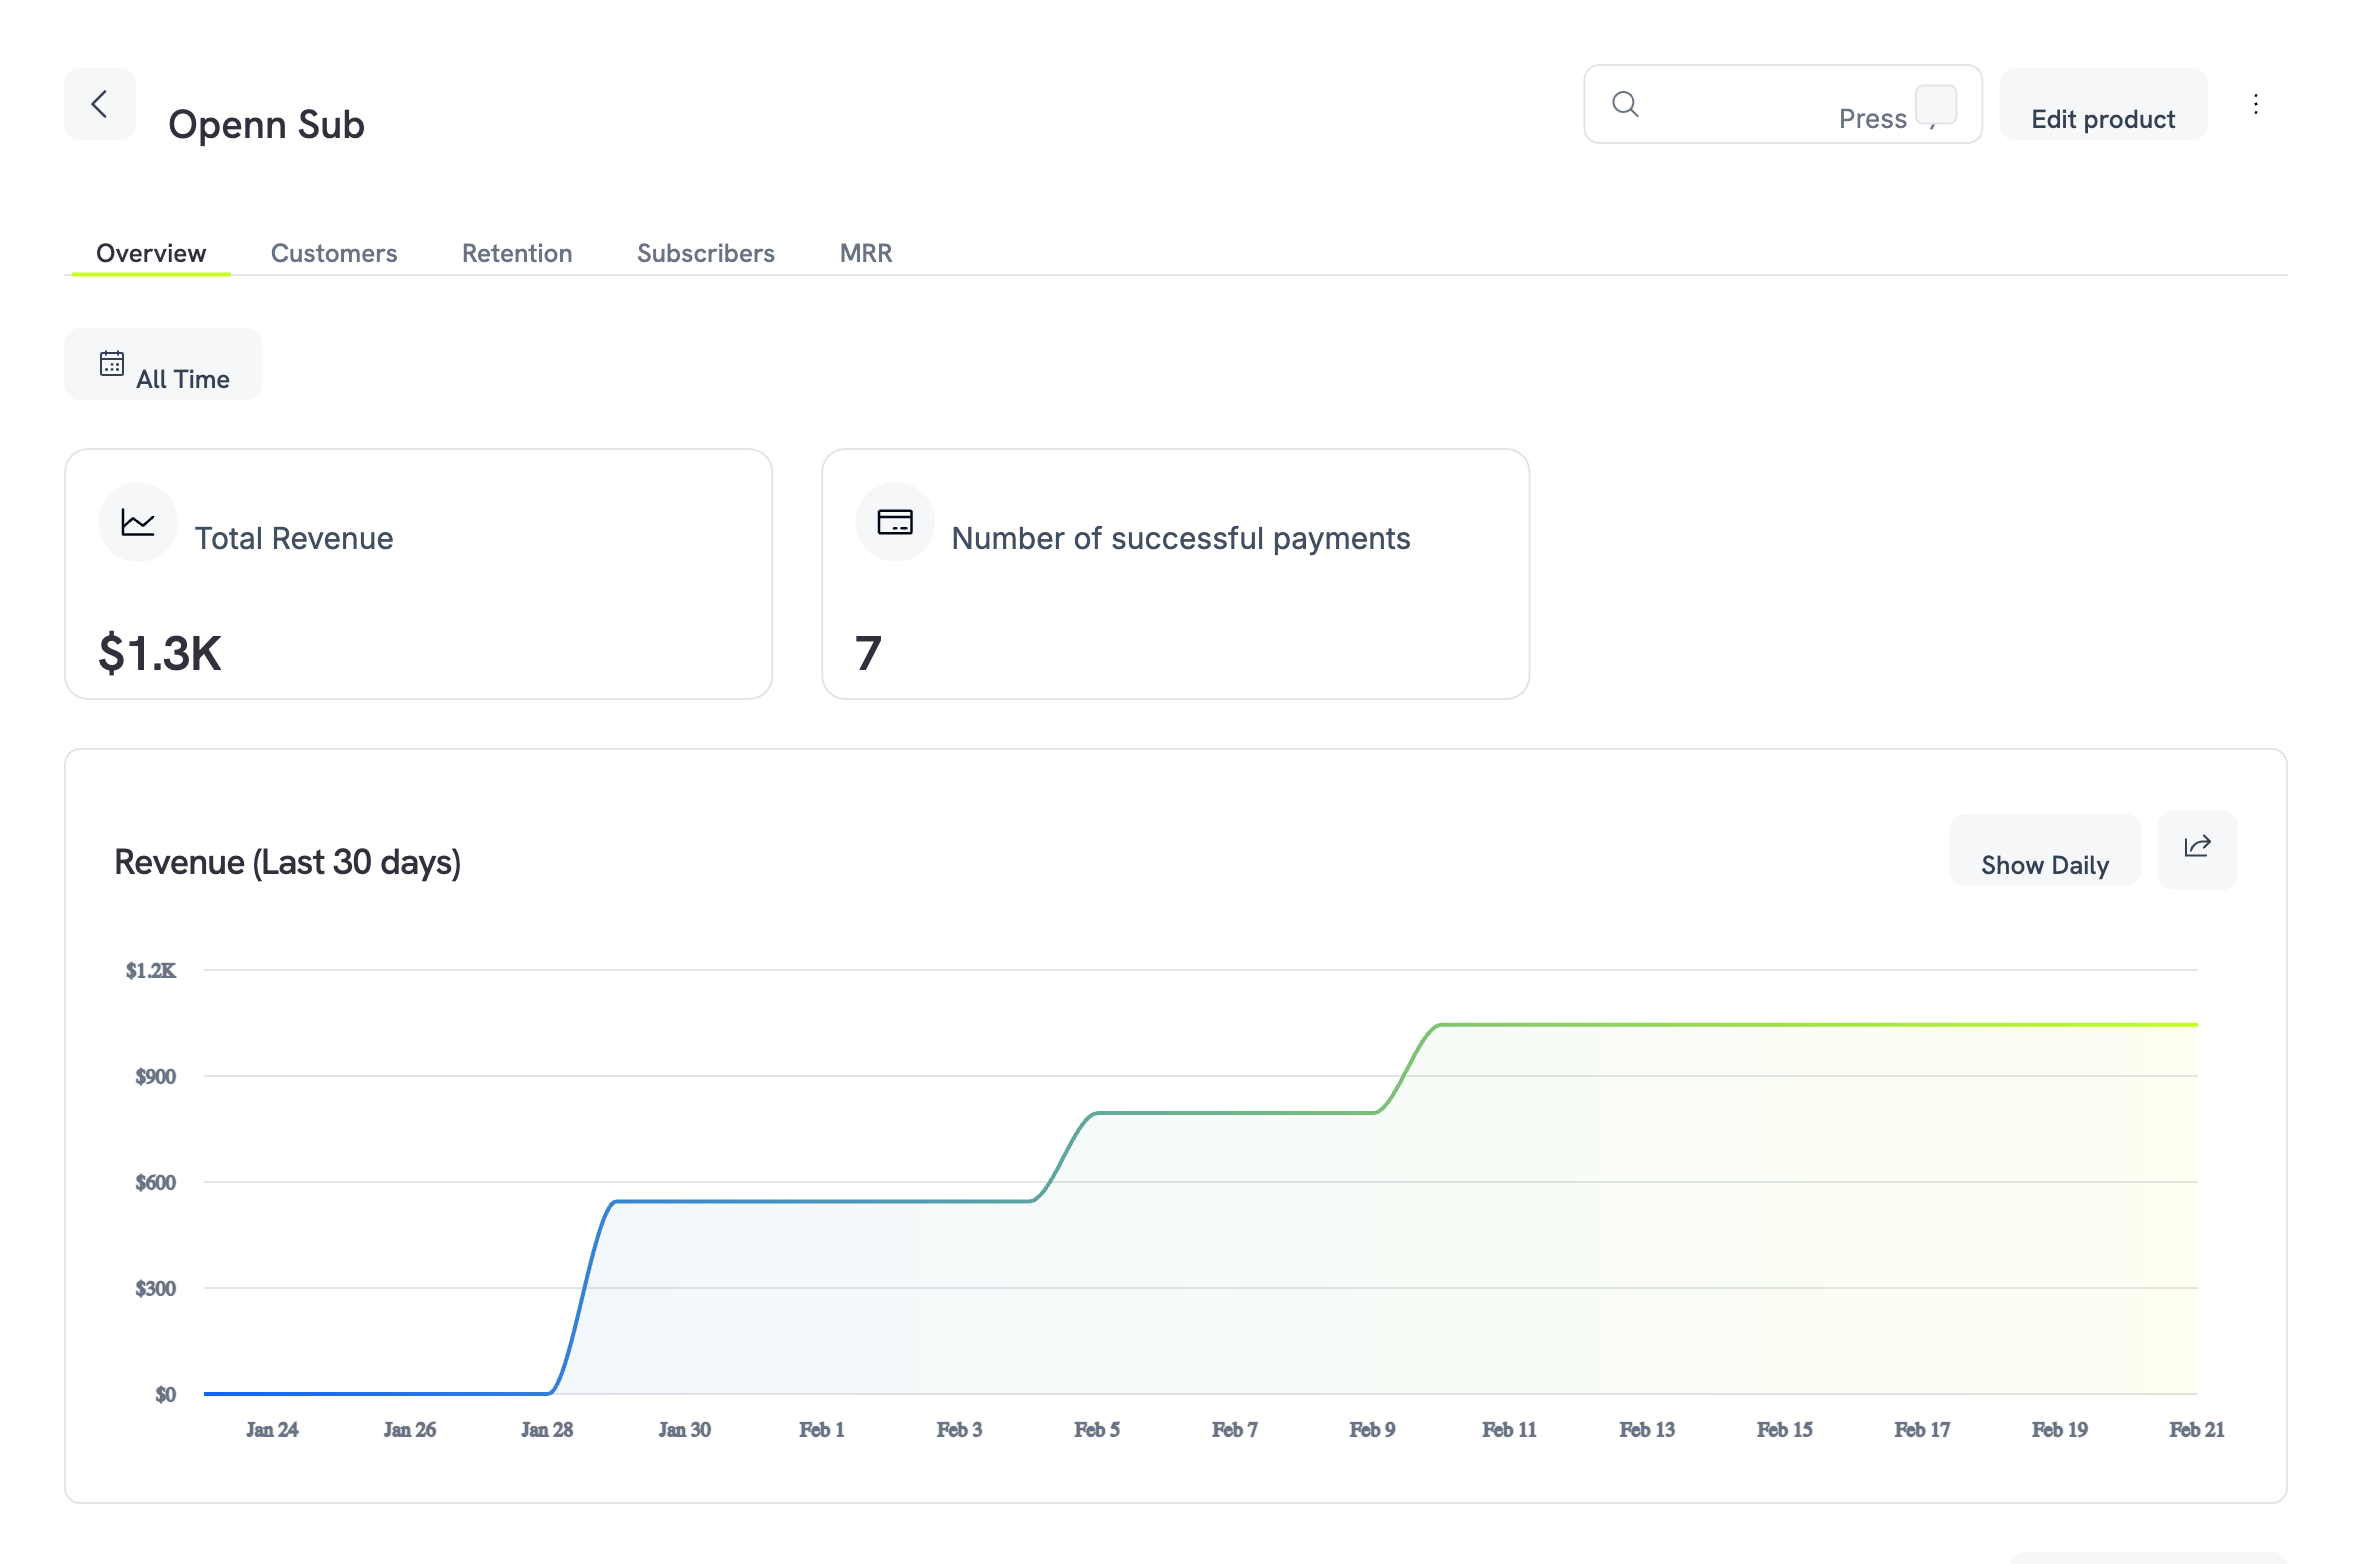 The product page has five tabs. **Subscribers** and **MRR** appear only for subscription products.
Revenue cards, plus the product's transactions and discounts.
Customer cards for this product, including top customers by spend.
Churn, retention, and trial conversion for this product.
All subscriptions with status and billing details.
Monthly Recurring Revenue breakdown: new, expansion, contraction, churned, and net.
One filter bar sets the period and comparison for every tab. It starts on **Last 30 days**, or on the range you last used for this business.
### Overview Tab
The Overview tab shows the product's Revenue cards: **Gross Volume**, **Net Volume**, **Payments Count**, **Payments Breakdown**, **Average Order Value**, and **Revenue By Country**. The [Revenue Tab](#revenue-tab) defines each metric.
Below the cards, a **Transactions** table lists every payment for this product:
| Column | Description |
| - | - |
| Payment ID | Unique identifier for the transaction |
| Status | The payment status, such as `Successful`, `Failed`, or `Processing` |
| Amount | Transaction amount with currency |
| Date | Timestamp of the transaction |
| Payment Method | Card, UPI, or other method used |
| Refund | Option to initiate a refund |
More columns show customer, subscription, currency, invoice, card, refund status, and dispute status details.
The product page has five tabs. **Subscribers** and **MRR** appear only for subscription products.
Revenue cards, plus the product's transactions and discounts.
Customer cards for this product, including top customers by spend.
Churn, retention, and trial conversion for this product.
All subscriptions with status and billing details.
Monthly Recurring Revenue breakdown: new, expansion, contraction, churned, and net.
One filter bar sets the period and comparison for every tab. It starts on **Last 30 days**, or on the range you last used for this business.
### Overview Tab
The Overview tab shows the product's Revenue cards: **Gross Volume**, **Net Volume**, **Payments Count**, **Payments Breakdown**, **Average Order Value**, and **Revenue By Country**. The [Revenue Tab](#revenue-tab) defines each metric.
Below the cards, a **Transactions** table lists every payment for this product:
| Column | Description |
| - | - |
| Payment ID | Unique identifier for the transaction |
| Status | The payment status, such as `Successful`, `Failed`, or `Processing` |
| Amount | Transaction amount with currency |
| Date | Timestamp of the transaction |
| Payment Method | Card, UPI, or other method used |
| Refund | Option to initiate a refund |
More columns show customer, subscription, currency, invoice, card, refund status, and dispute status details.
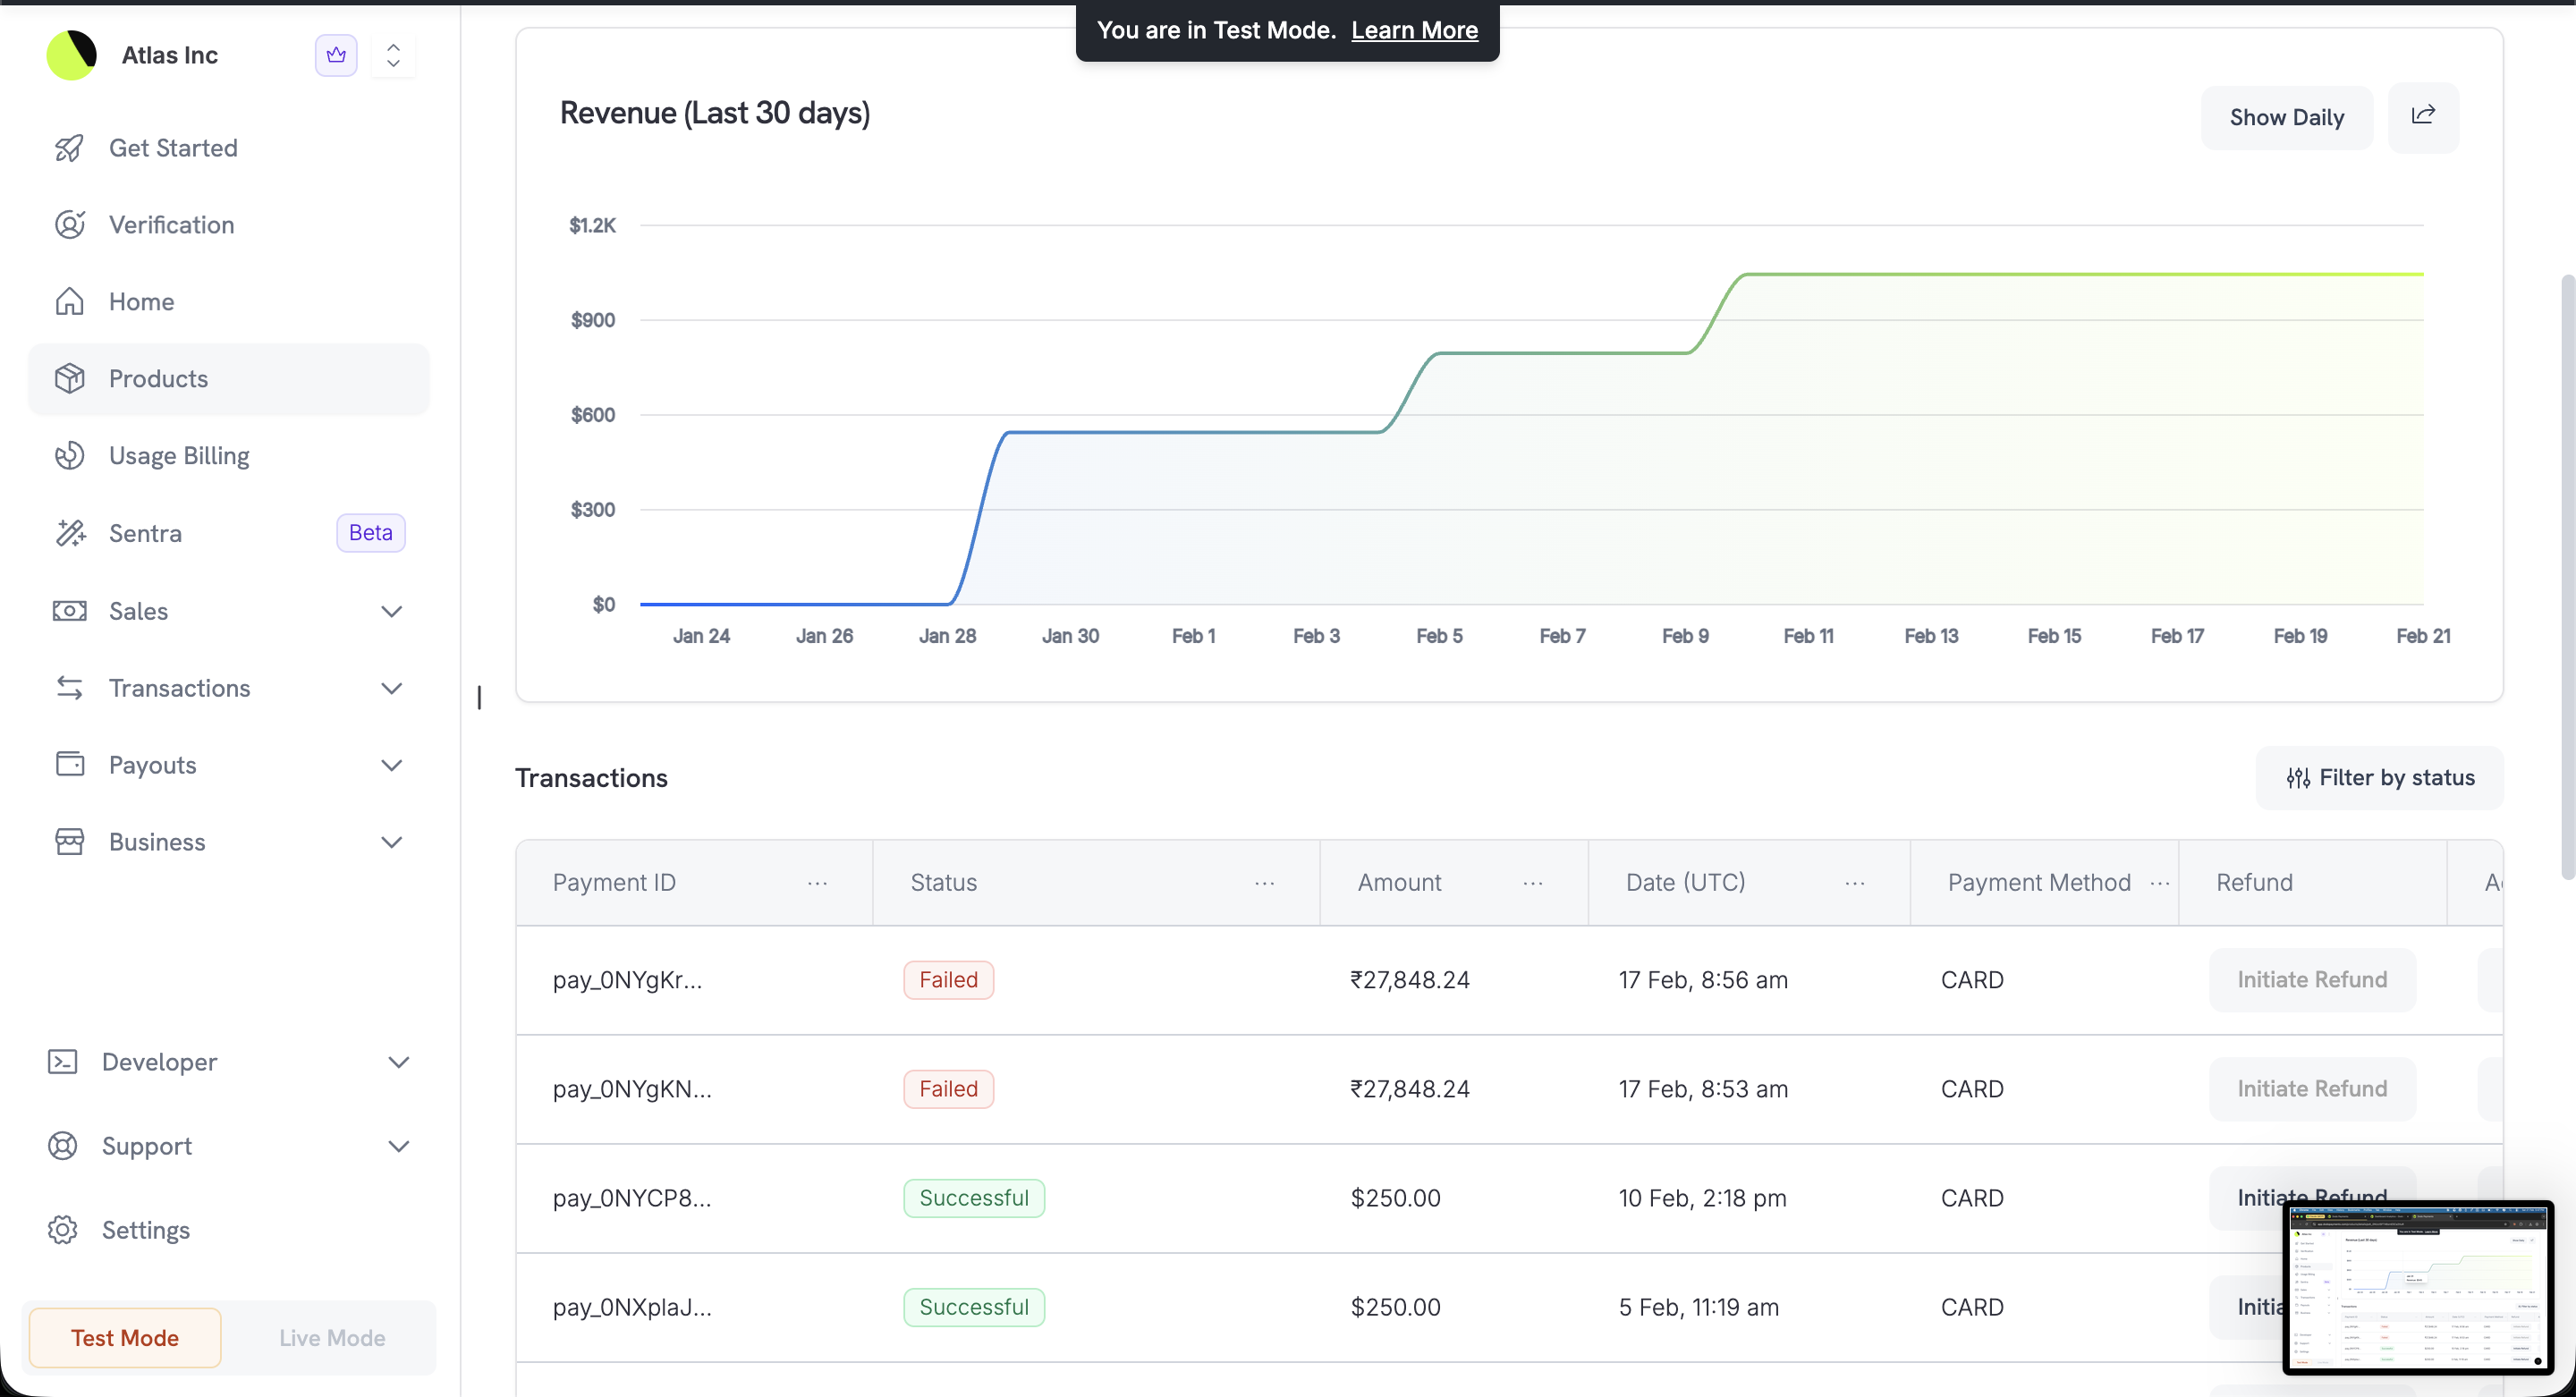 To narrow the list by status, click **Filter by status** and choose **Not initiated**, **In progress**, **On hold**, **Failed**, or **Success**. A **Discounts** table follows the transactions.
### Customers Tab
See who buys this product and how much they spend.
To narrow the list by status, click **Filter by status** and choose **Not initiated**, **In progress**, **On hold**, **Failed**, or **Success**. A **Discounts** table follows the transactions.
### Customers Tab
See who buys this product and how much they spend.
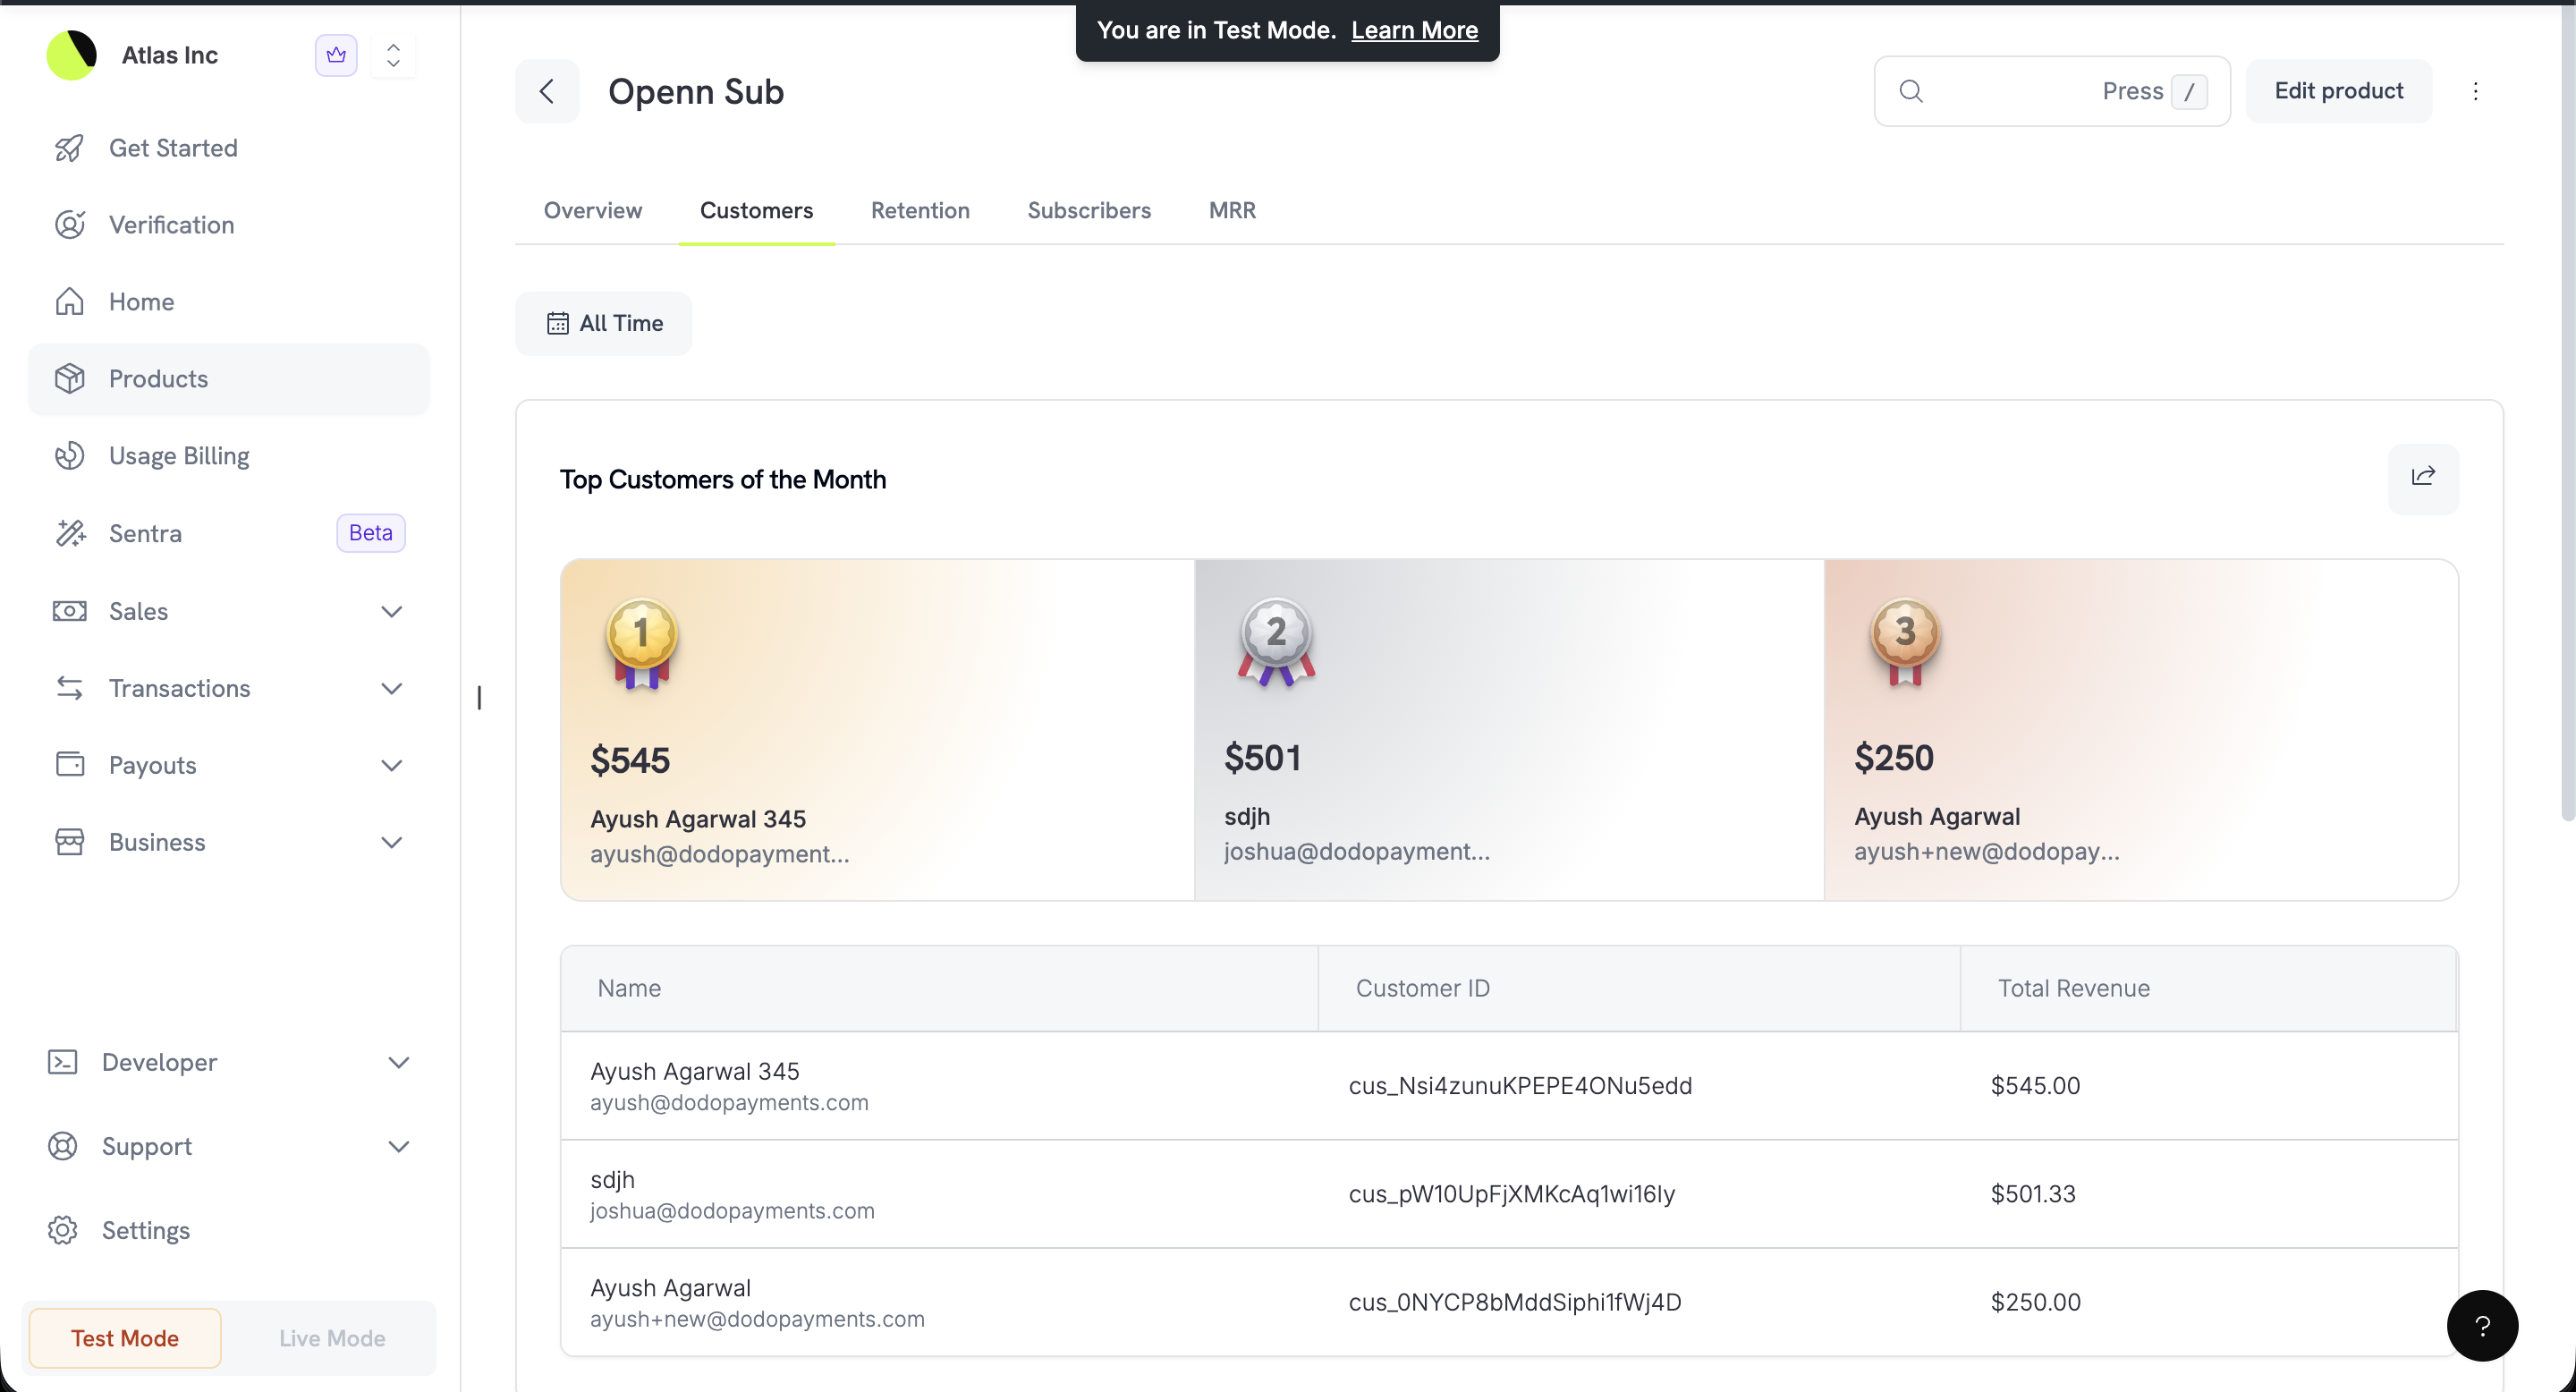 The Customers tab shows the product's customer cards: **Active Customers**, **New Customers**, **ARPU**, **Top Customers by Spend**, **New VS Returning**, and **LTV (model)**. **Top Customers by Spend** ranks customers by the revenue this product earned from them. The [Customers Tab](#customers-tab) under **Analytics** defines each metric.
### Retention Tab
See how well this product keeps its subscribers.
The Customers tab shows the product's customer cards: **Active Customers**, **New Customers**, **ARPU**, **Top Customers by Spend**, **New VS Returning**, and **LTV (model)**. **Top Customers by Spend** ranks customers by the revenue this product earned from them. The [Customers Tab](#customers-tab) under **Analytics** defines each metric.
### Retention Tab
See how well this product keeps its subscribers.
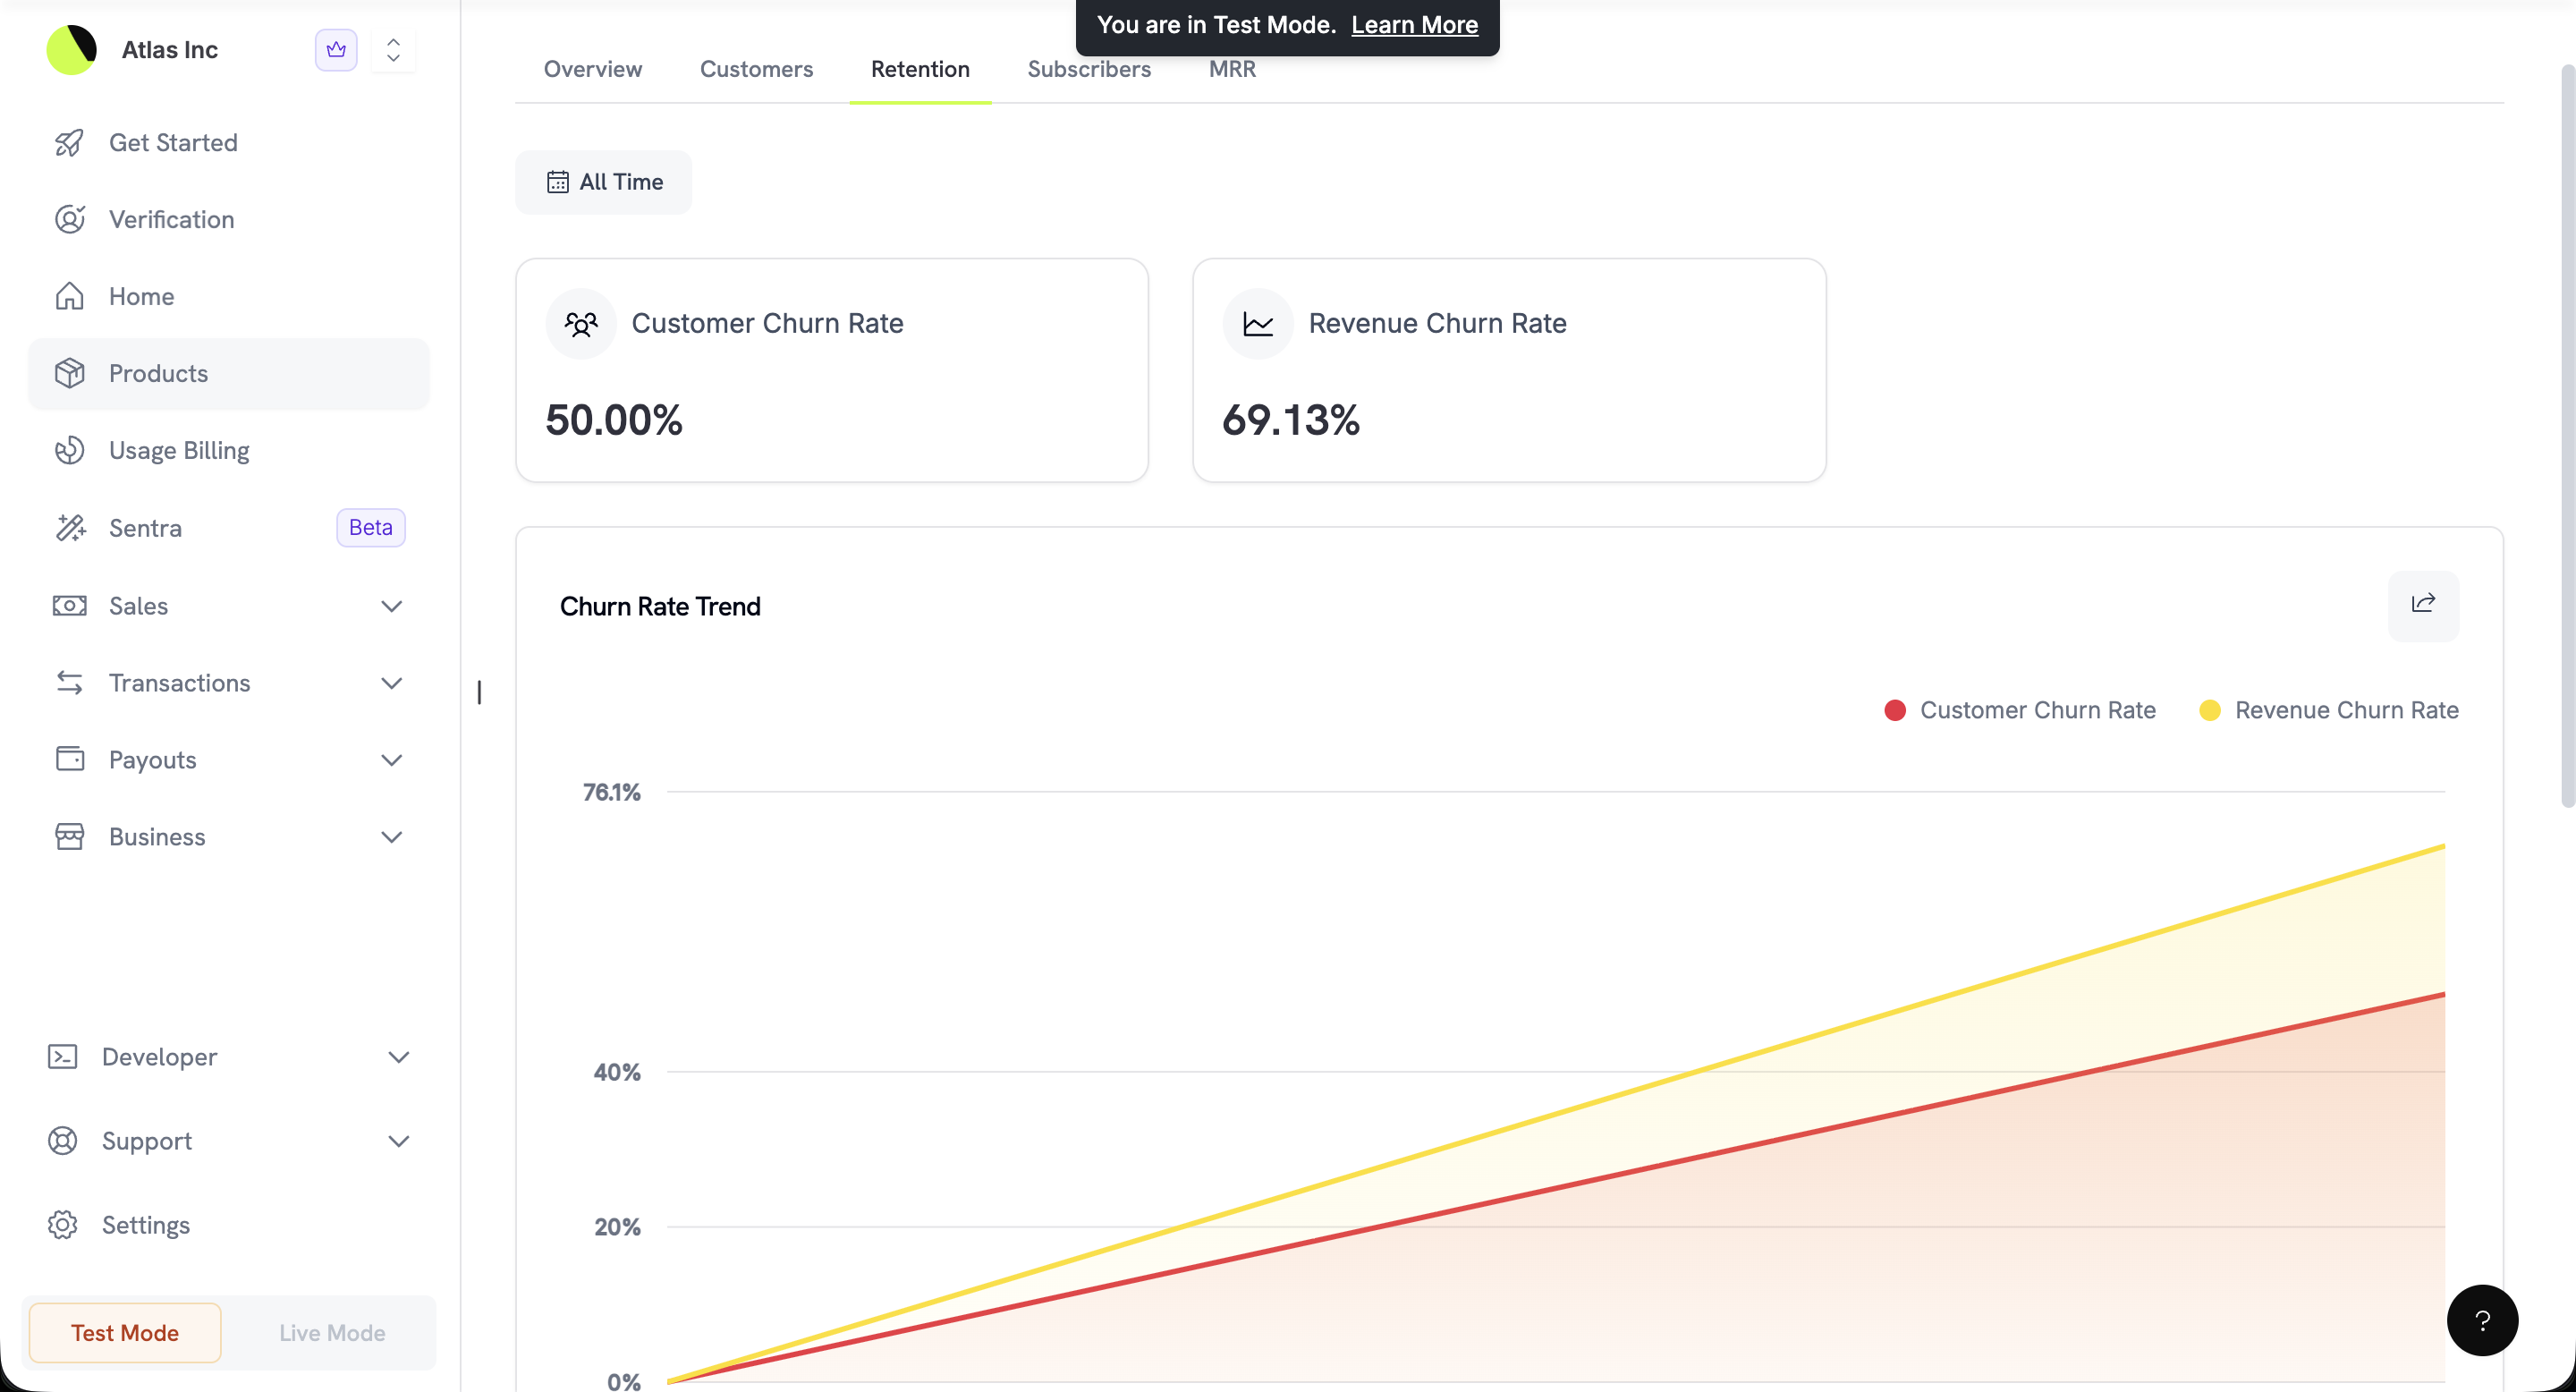 The Retention tab shows the product's retention cards: **User Retention**, **Customer Churn Rate**, **Revenue Churn Rate**, **Net Revenue Retention**, **Gross Revenue Retention**, and **Trial Conversion**. Customer churn rate is the share of subscribers who cancelled. Revenue churn rate is the share of MRR lost to cancellations. Track both over time to spot trends early and act on them.
### Subscribers Tab
A list of the subscriptions for this product that were created in the selected period.
The Retention tab shows the product's retention cards: **User Retention**, **Customer Churn Rate**, **Revenue Churn Rate**, **Net Revenue Retention**, **Gross Revenue Retention**, and **Trial Conversion**. Customer churn rate is the share of subscribers who cancelled. Revenue churn rate is the share of MRR lost to cancellations. Track both over time to spot trends early and act on them.
### Subscribers Tab
A list of the subscriptions for this product that were created in the selected period.
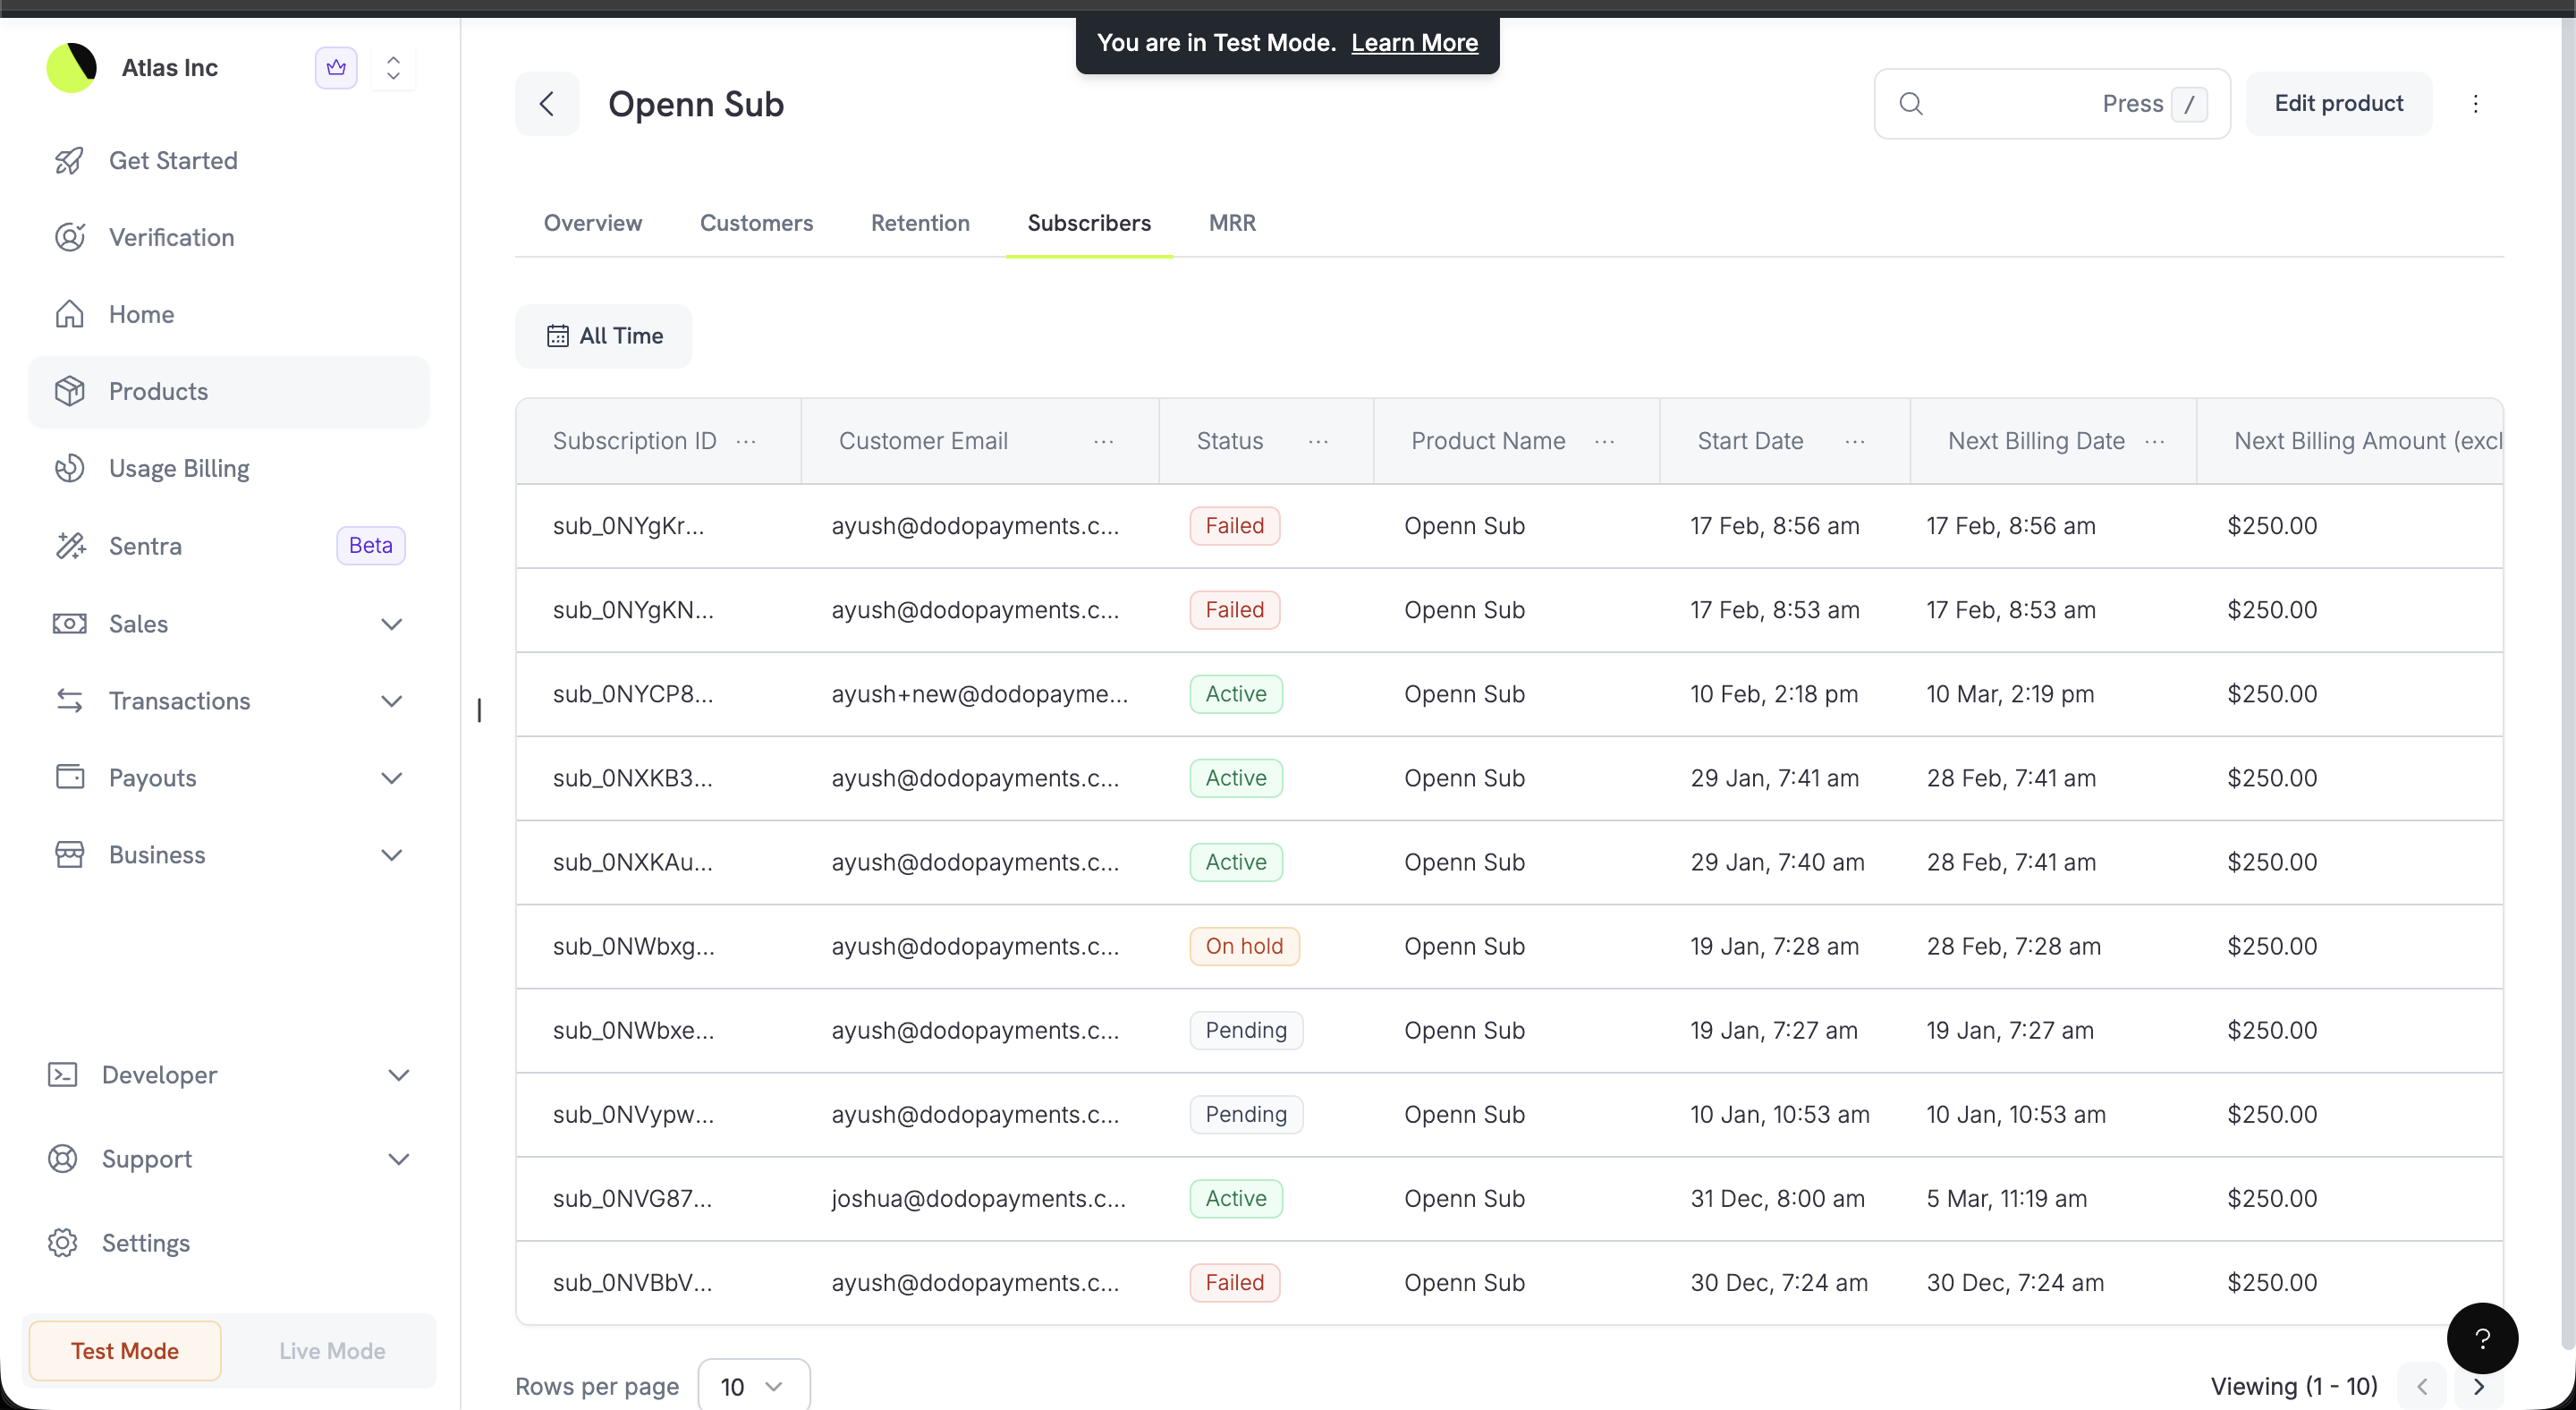 | Column | Description |
| - | - |
| Subscription ID | Unique identifier for the subscription |
| Customer Email | The subscriber's email address |
| Status | `Active`, `Pending`, `On hold`, `Paused`, `Failed`, `Cancelled`, `Expired`, or `Scheduled for Cancellation` |
| Product Name | The product this subscription belongs to |
| Quantity | The number of units on the subscription |
| Start Date | When the subscription began |
| Next Billing Date | The upcoming renewal date |
| Next Billing Amount | The amount due at next renewal (excluding tax) |
More columns show the customer's name and business name, billing frequency, trial days, cancellation details, tax details, and IDs.
### MRR Tab
A breakdown of the product's Monthly Recurring Revenue.
| Column | Description |
| - | - |
| Subscription ID | Unique identifier for the subscription |
| Customer Email | The subscriber's email address |
| Status | `Active`, `Pending`, `On hold`, `Paused`, `Failed`, `Cancelled`, `Expired`, or `Scheduled for Cancellation` |
| Product Name | The product this subscription belongs to |
| Quantity | The number of units on the subscription |
| Start Date | When the subscription began |
| Next Billing Date | The upcoming renewal date |
| Next Billing Amount | The amount due at next renewal (excluding tax) |
More columns show the customer's name and business name, billing frequency, trial days, cancellation details, tax details, and IDs.
### MRR Tab
A breakdown of the product's Monthly Recurring Revenue.
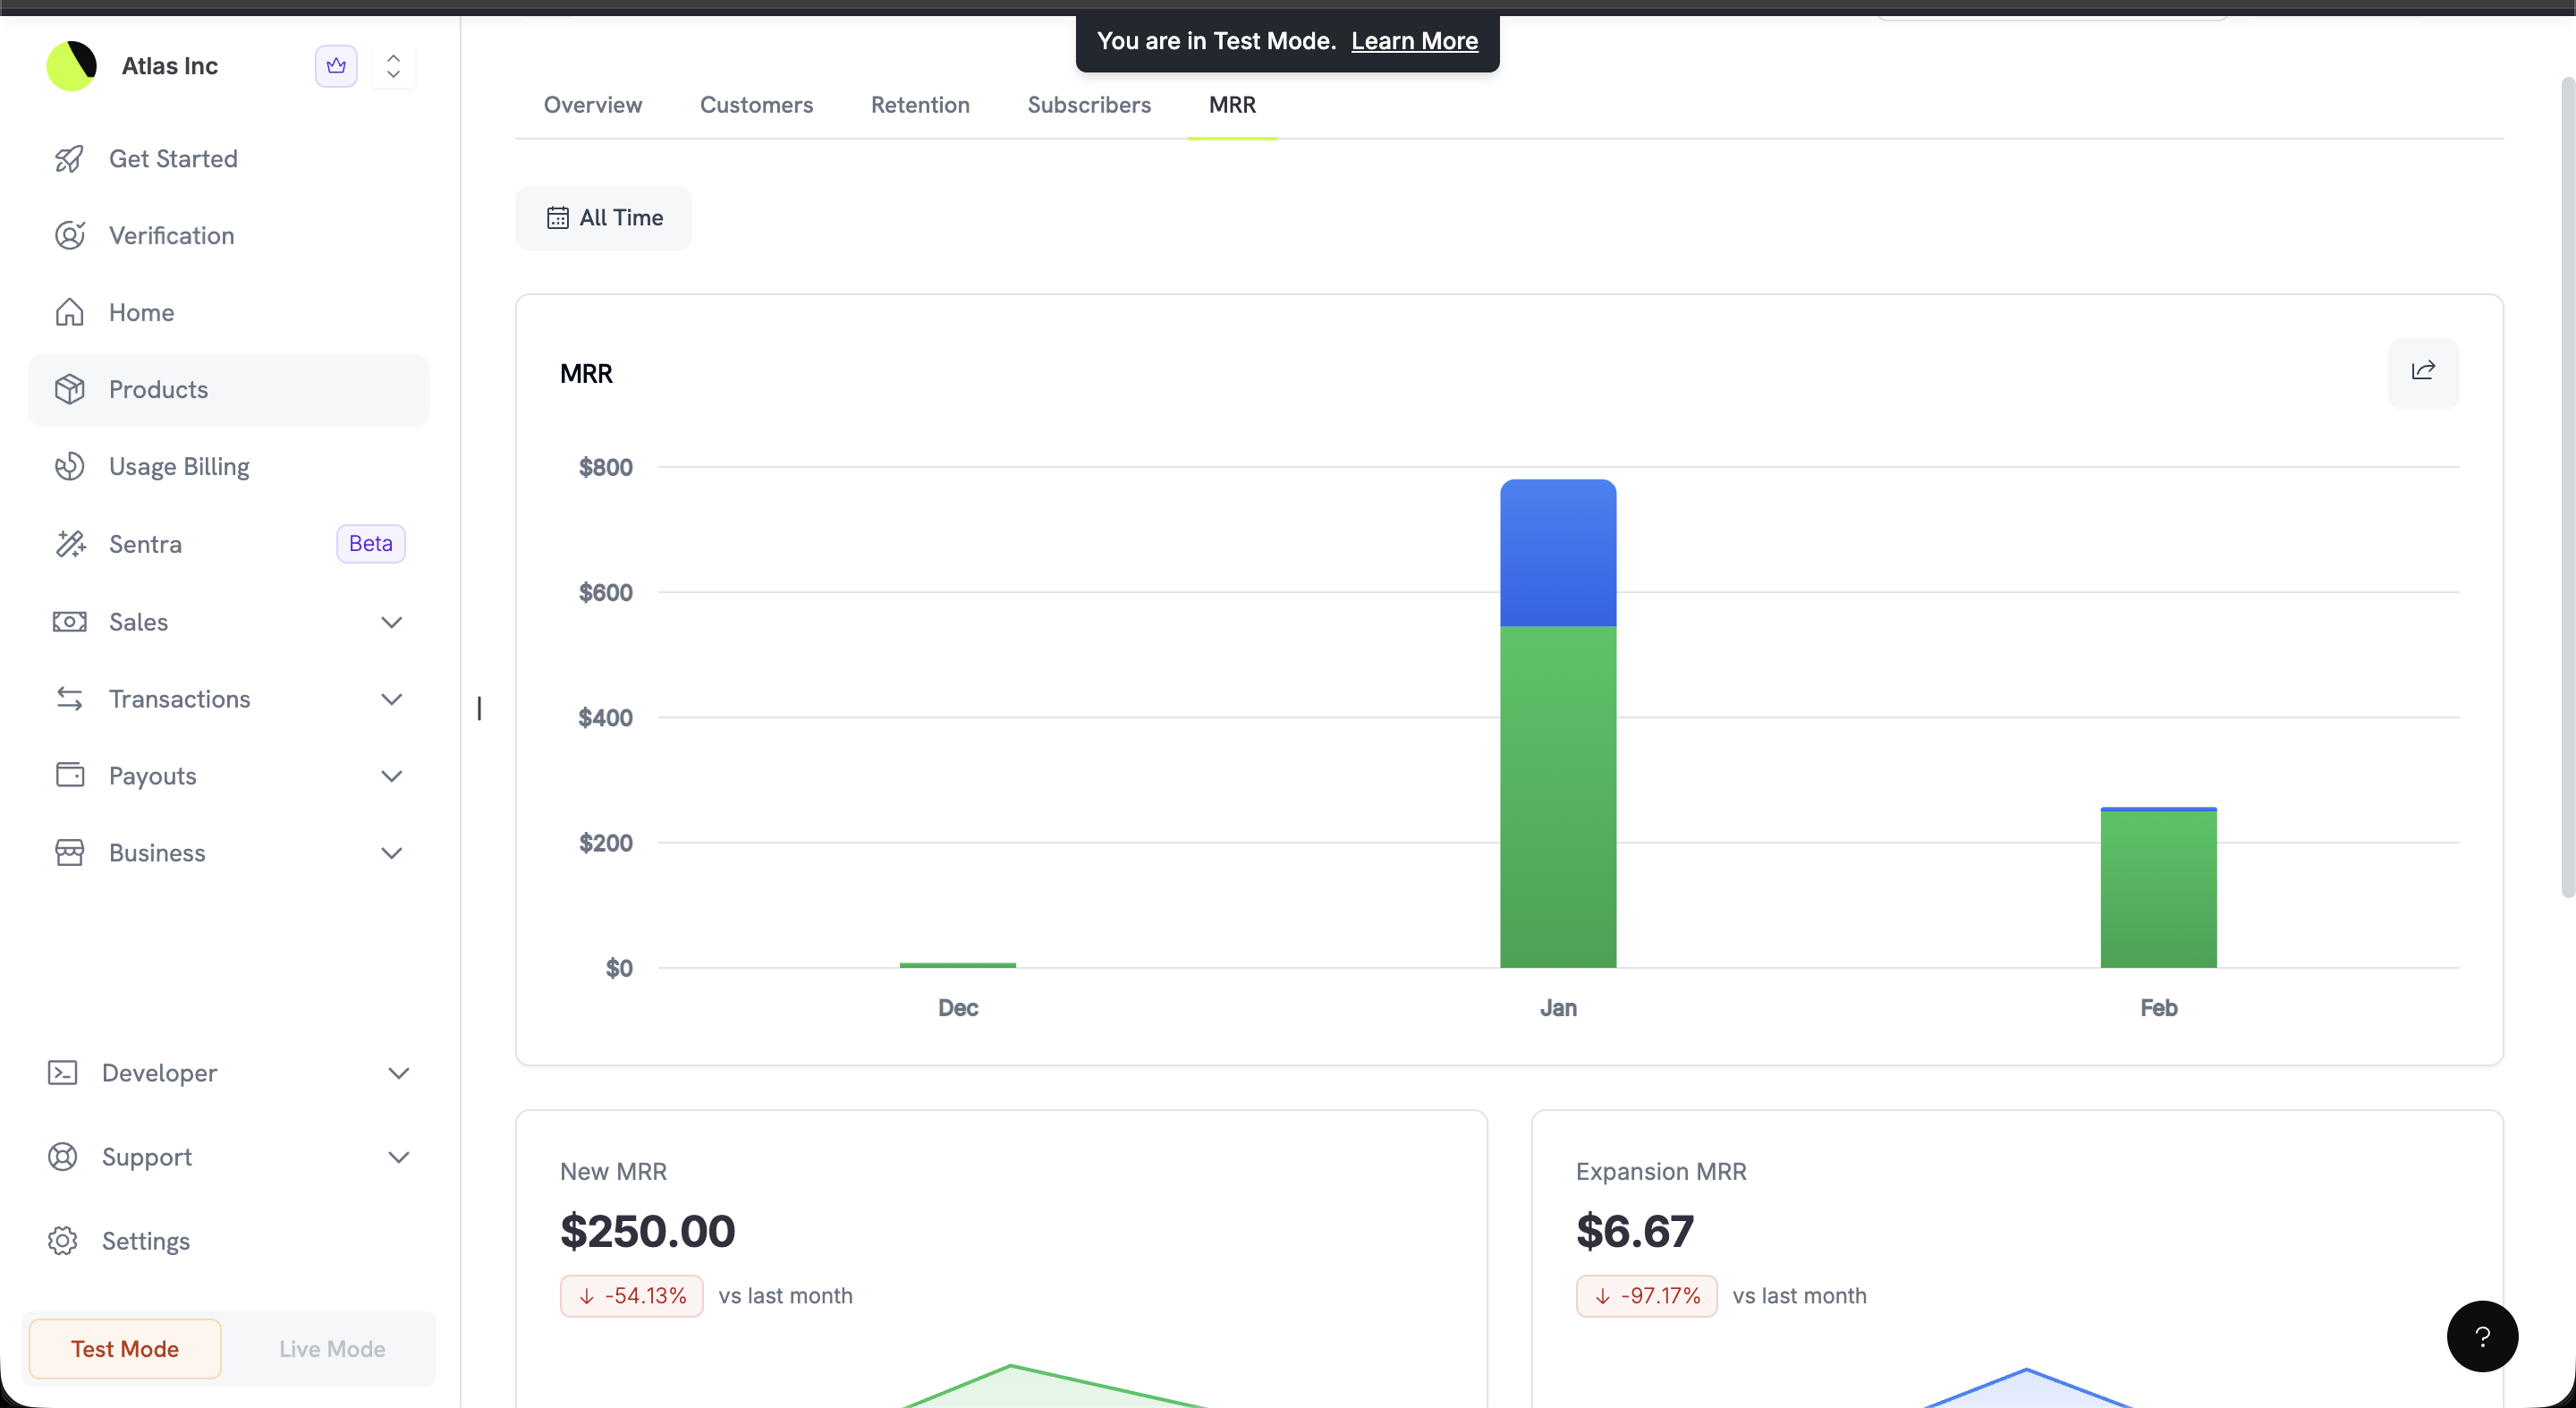 The MRR tab shows the product's subscription cards: **Current MRR**, **Projected ARR**, **Net New MRR**, and **Active Subscriptions**, plus the MRR components below.
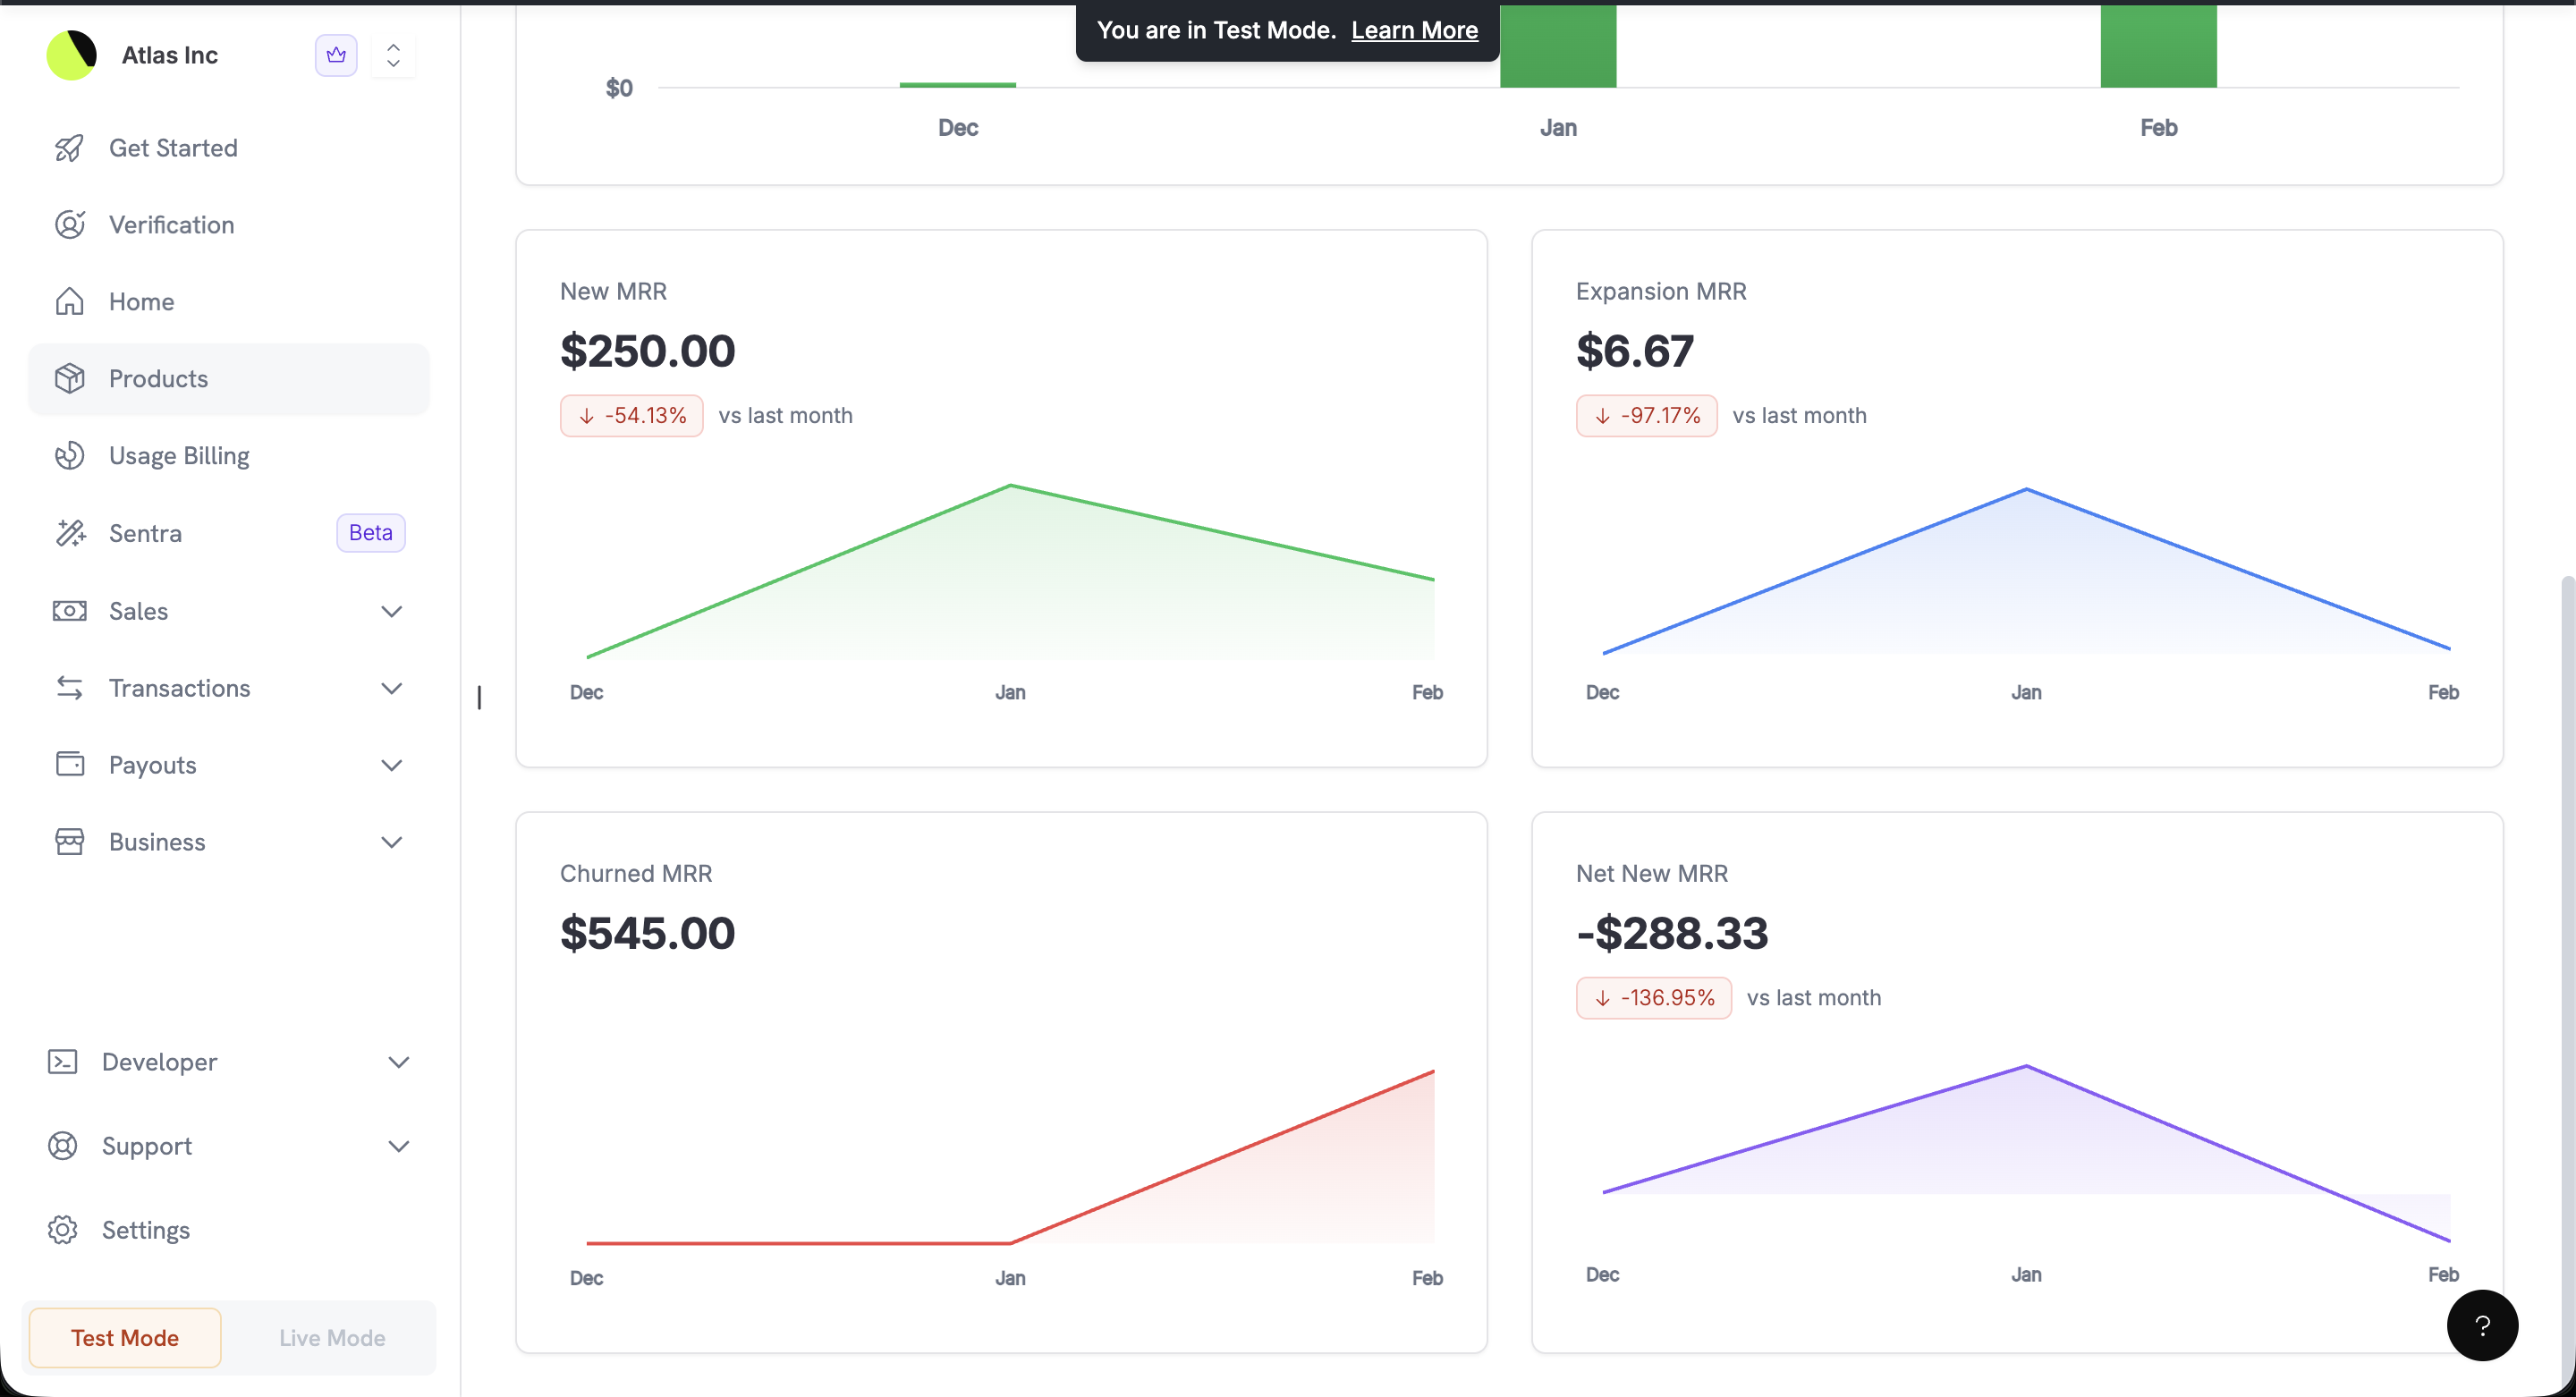 | Metric | Description |
| - | - |
| **New MRR** | MRR from new subscriptions in the period |
| **Expansion MRR** | Extra MRR from existing subscribers upgrading or buying add-ons |
| **Contraction MRR** | MRR lost when existing subscribers downgrade without cancelling |
| **Churned MRR** | MRR lost from cancelled subscriptions |
| **Net New MRR** | The net result: New MRR + Expansion MRR − Contraction MRR − Churned MRR |
Each card compares its value with the comparison period you pick in the filter bar.
## Page Highlight Tiles
Many list pages in your dashboard show **highlight tiles** at the top, with summary metrics you can read without opening **Analytics**. The tiles follow the page's active filters.
| Page | Highlight Tiles |
| - | - |
| **Products** | All Products, Active Products, Archived Products |
| **Add-ons** | All Add-Ons, Active Add-Ons, Linked to Products |
| **Collections** | All Collections, Active Collections, Archived Collections |
| **Subscriptions** | Active Subscriptions, On Hold, Cancelled |
| **Payments** | Successful Payments, Payment Volume, Failed Payments |
| **Refunds** | Successful Refunds, Refund Volume, Failed Refunds |
| **Disputes** | Disputes Created, Won, Accepted, Lost |
"Active" products, add-ons, collections, and meters are those that have been part of at least one successful payment.
## Reports
Reports have their own page: **Settings → Reports**. There you can track money movement on screen and build a CSV or XLSX export for any date range. Reports cover live mode only.
Balance and Payout Summary, All Fees, and four downloadable reports, with filters, row limits, and your full report history.
Two views explain your balance and your fees on screen. Four more build a download for any date range.
| Metric | Description |
| - | - |
| **New MRR** | MRR from new subscriptions in the period |
| **Expansion MRR** | Extra MRR from existing subscribers upgrading or buying add-ons |
| **Contraction MRR** | MRR lost when existing subscribers downgrade without cancelling |
| **Churned MRR** | MRR lost from cancelled subscriptions |
| **Net New MRR** | The net result: New MRR + Expansion MRR − Contraction MRR − Churned MRR |
Each card compares its value with the comparison period you pick in the filter bar.
## Page Highlight Tiles
Many list pages in your dashboard show **highlight tiles** at the top, with summary metrics you can read without opening **Analytics**. The tiles follow the page's active filters.
| Page | Highlight Tiles |
| - | - |
| **Products** | All Products, Active Products, Archived Products |
| **Add-ons** | All Add-Ons, Active Add-Ons, Linked to Products |
| **Collections** | All Collections, Active Collections, Archived Collections |
| **Subscriptions** | Active Subscriptions, On Hold, Cancelled |
| **Payments** | Successful Payments, Payment Volume, Failed Payments |
| **Refunds** | Successful Refunds, Refund Volume, Failed Refunds |
| **Disputes** | Disputes Created, Won, Accepted, Lost |
"Active" products, add-ons, collections, and meters are those that have been part of at least one successful payment.
## Reports
Reports have their own page: **Settings → Reports**. There you can track money movement on screen and build a CSV or XLSX export for any date range. Reports cover live mode only.
Balance and Payout Summary, All Fees, and four downloadable reports, with filters, row limits, and your full report history.
Two views explain your balance and your fees on screen. Four more build a download for any date range.
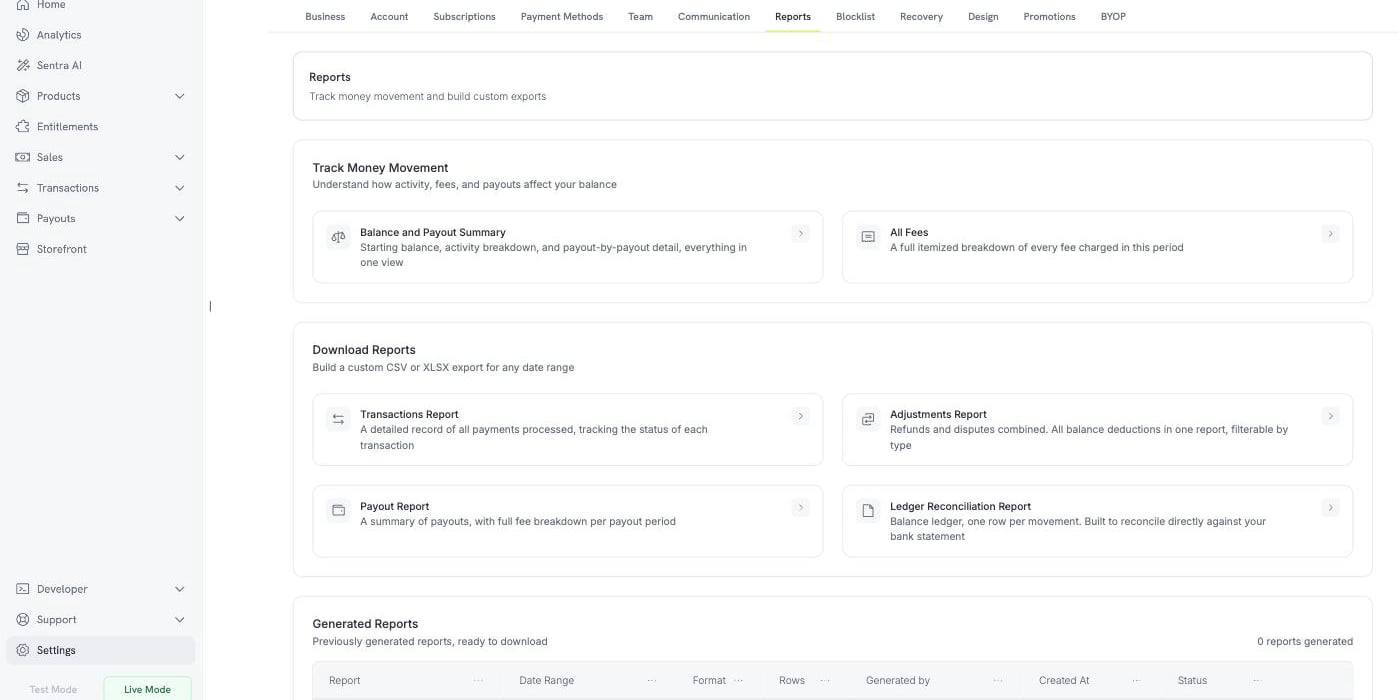 Fees have a dedicated view. Open **All Fees** under **Settings → Reports** for a total and a per-transaction breakdown.
## Best Practices
* Review your analytics regularly to spot trends and anomalies early.
* Use filters to compare performance across products and time periods, and **Revenue By Country** to compare markets.
* Open product-level analytics to see which products drive the most revenue and which have the highest churn.
* If data looks wrong or missing, check your filters and date range first.
If discrepancies persist or data is still missing after you check your filters, contact support.
Email [support@dodopayments.com](mailto:support@dodopayments.com) with the page, the metric, and the date range.
## Next Steps
Understand your earnings, deductions, and payout cycles.
Create and manage your products.
Track and manage all payment transactions.
Initiate and monitor refunds.
This documentation is built and hosted on [Mintlify](https://mintlify.com), a developer documentation platform.
Fees have a dedicated view. Open **All Fees** under **Settings → Reports** for a total and a per-transaction breakdown.
## Best Practices
* Review your analytics regularly to spot trends and anomalies early.
* Use filters to compare performance across products and time periods, and **Revenue By Country** to compare markets.
* Open product-level analytics to see which products drive the most revenue and which have the highest churn.
* If data looks wrong or missing, check your filters and date range first.
If discrepancies persist or data is still missing after you check your filters, contact support.
Email [support@dodopayments.com](mailto:support@dodopayments.com) with the page, the metric, and the date range.
## Next Steps
Understand your earnings, deductions, and payout cycles.
Create and manage your products.
Track and manage all payment transactions.
Initiate and monitor refunds.
This documentation is built and hosted on [Mintlify](https://mintlify.com), a developer documentation platform.